Bookmap
The Profile ladder beside the liquidity heatmap: two books in one picture.

What it shows
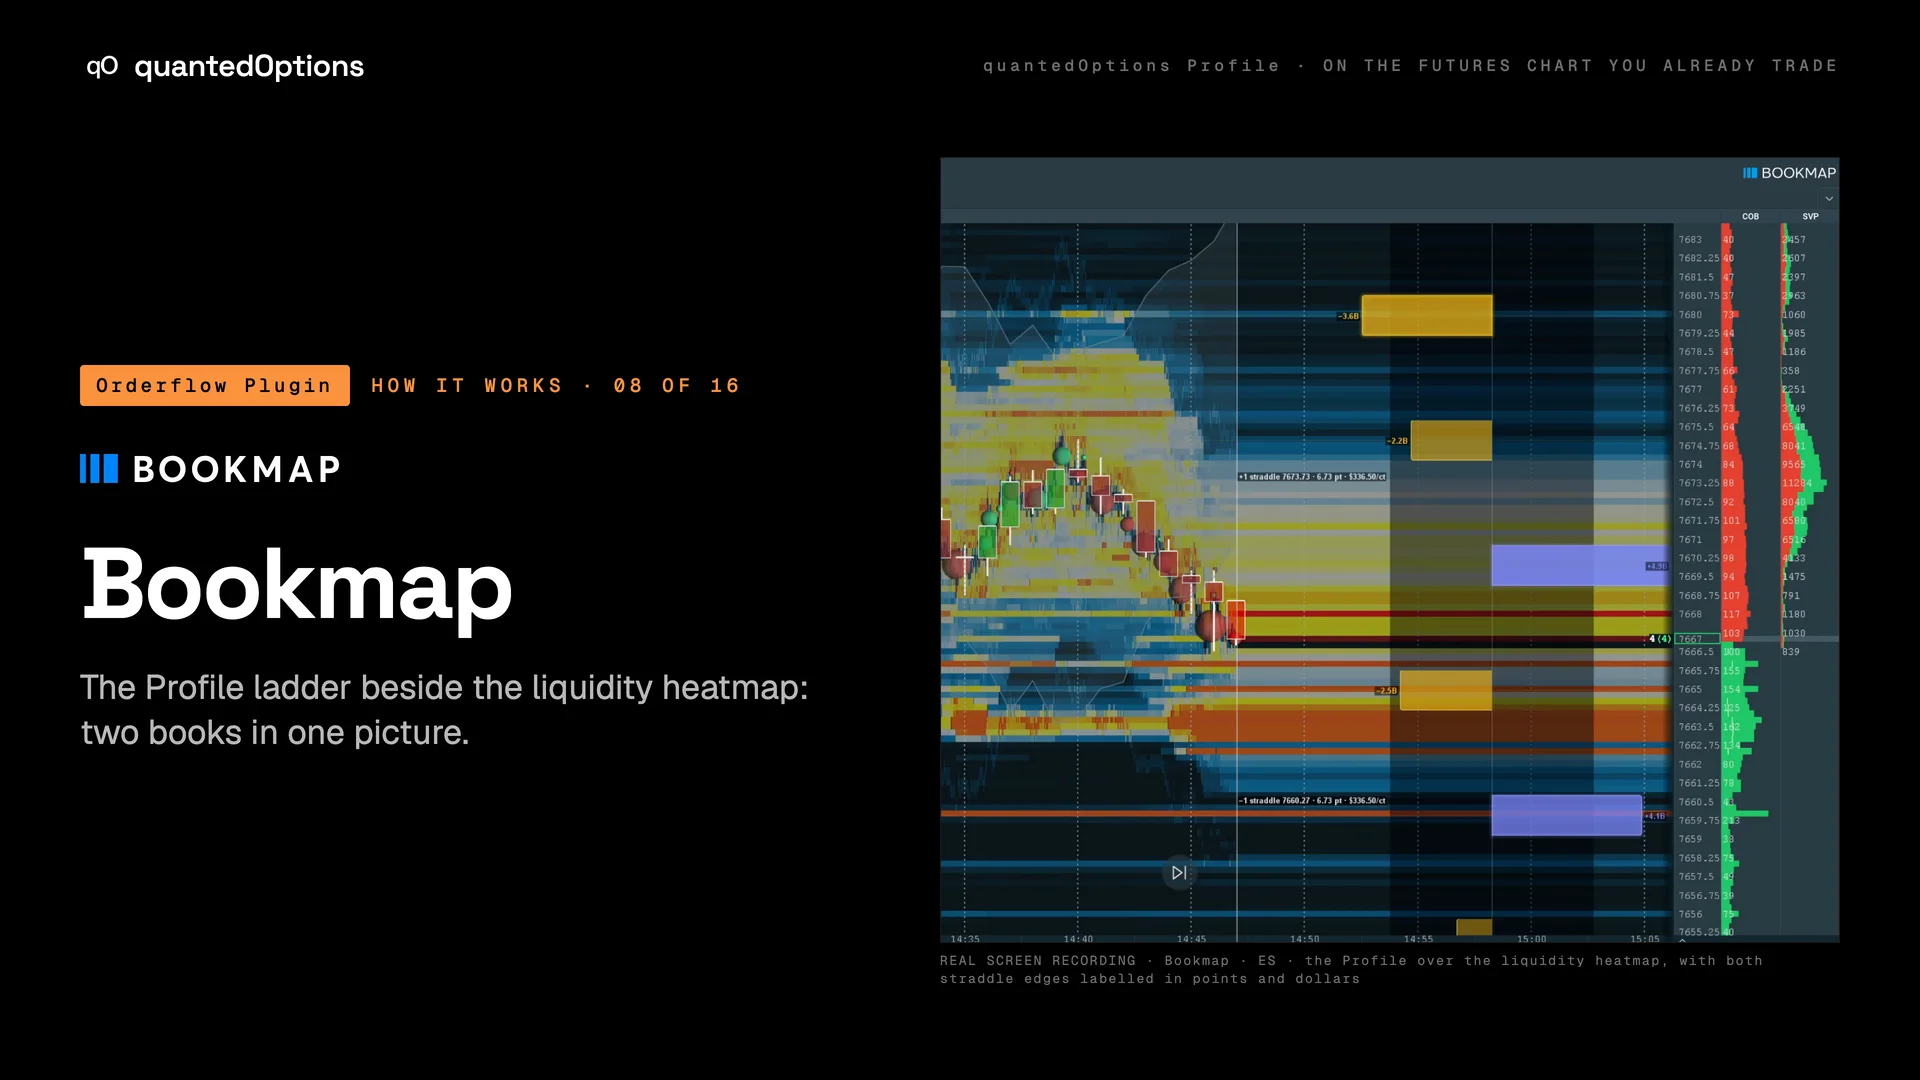
The market-maker book and the order book in one picture. The Profile sits against Bookmap's liquidity heatmap, so you see resting size and market-maker gamma at the same price at the same moment. An 'over heatmap' mode with dark halos keeps the bars and labels readable on top of a bright heatmap.
What it is built from
The same data, the same settings and the same key as every other platform. On ES and MES: licensed CBOE one-minute data with market-maker positioning, from SPX. On the other families: computed from data consolidated across every US options exchange: open interest and volume.
On this platform
Only on Bookmap
The ladder beside the liquidity heatmap, with an 'over heatmap' mode that keeps the bars readable on top of it.
- Runs on
- Bookmap 7 or newer, on Bookmap Global and Global+
- OS
- Windows · macOS
Three steps
- 01Download the Bookmap add-on (one .jar) from your Orderflow Plugin page.
- 02In Bookmap open Add-ons › Configure add-ons, click Add and pick the file.
- 03Switch it on for your instrument, paste your key, leave Source ticker on AUTO and click Apply connection.
Reading
How to read it
- Resting size on the heatmap and a positive node at the same price are two readings at one level.
- A negative node lets price through; the heatmap shows what is resting beyond it.
- The straddle band is labelled on the chart and the panel sits bottom-left.
- The Profile draws behind the bars by default; switch to the over-heatmap mode on a bright heatmap.
Settings
What each setting does
| Setting | Options | What it changes |
|---|---|---|
| 'Over heatmap' mode | Dark halos keep the bars and labels readable on top of a bright heatmap. | |
| Dark background behind the ladder | Off, Light, Strong (Bookmap default Light) | A dark backing behind the ladder. |
| Draw behind the price bars | on / off (default on) | Ladder under the price bars, or over them. |
| Apply connection | button | Connection changes take effect when you click it. |
Read it with
- Gamma nodes at the strikes — one bar per strike: positive nodes slow price, negative nodes let it through
- The data panel — the regime, the nearest nodes, the top strikes and what changed, in one corner
- The live ATM straddle band (±1) — the session's expected move, priced live by the options market, on your chart
Good to know
- Runs on any Bookmap 7 instrument you switch it on for.
- On Bookmap the Profile covers the ES, NQ, RTY, YM and GC families, micros included.
On a real chart
See it happen
Bookmap · ES: the Profile bars sit over the liquidity heatmap, with both straddle edges labelled in points and dollars. Point at a positive node and the resting size on the heatmap at the same price: two readings at one level.
11 slides
The walk-through, slide by slide
Slide 1 / 11
These pages describe what the displays show and what the data did on the sessions shown. They are not trading advice, and a past session is not a forecast of a future one.