Day and night: the overnight session and the roll
Live overnight; after the cash close it rolls to the next expiry.
What it shows
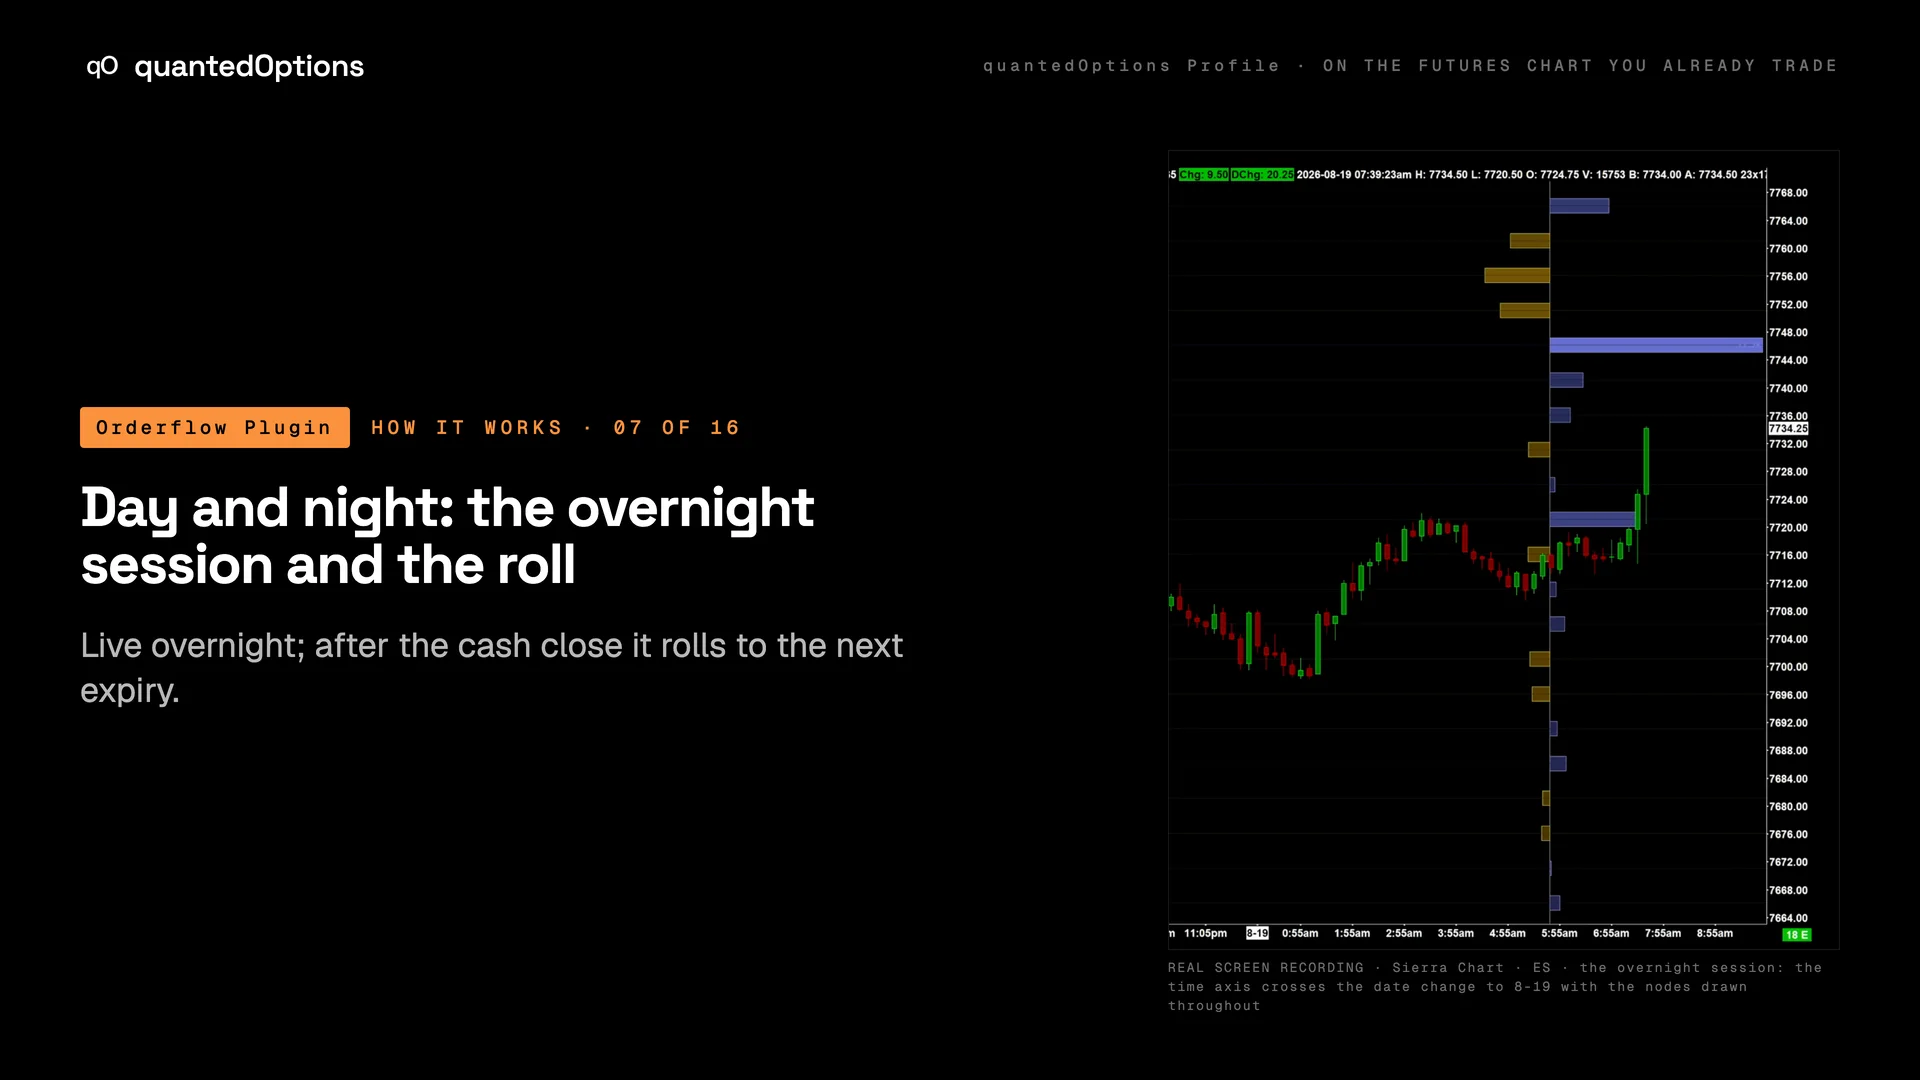
The Profile updates day and night on the one-minute clock, automatically, from New York to London to Singapore. After the cash close the data rolls to the next trading day: the overnight session is locked to the upcoming expiry, so after hours your chart already carries the gamma levels for the session ahead. The panel's first line carries the expiry date and the freshness dot shows how current the data is.
What it is built from
On ES and MES: licensed CBOE one-minute data with market-maker positioning, from SPX, computed and delivered every minute. On the other families: computed from data consolidated across every US options exchange: open interest and volume.
Reading
How to read it
- The panel's first line names the expiry on screen: '0DTE 08-20' before the roll, '0DTE 08-21' after it.
- After the roll the Change rows read 'warming' while each window fills, then show changes as usual.
- Overnight, read it the same way as in the day: the regime, the nearest node each side, the band.
- The freshness dot stays the reference: green = fresh, amber = a few minutes old, red = stale.
Settings
What each setting does
| Setting | Options | What it changes |
|---|---|---|
| Book | Today's / nearest expiry, All expiries | Today's / nearest expiry follows the roll to the upcoming expiry; All expiries keeps every listed expiry in one profile. |
| Change windows: Since open / Since premarket | on / off (default off) | Adds a row for the change since 09:30 ET, or since the premarket anchor. |
Read it with
- The data panel — the expiry date and the freshness dot
- Cumulative Net Gamma — late in the day, All − 0DTE on the dashboard is tomorrow's regime
- Date menu — a calendar of stored sessions; pick one and the whole page loads it
Good to know
- Nothing to re-add and nothing to reload: the study added once carries on through the close, the roll and the overnight session.
- Outside market hours the last data is held and the dot stays green.
On a real chart
See it happen
Sierra Chart · ES overnight: the time axis runs through the evening and across the date change, with the nodes drawn throughout. After the roll to the next expiry the panel's Change rows read 'warming' until the new session has history.
11 slides
The walk-through, slide by slide
Slide 1 / 11
These pages describe what the displays show and what the data did on the sessions shown. They are not trading advice, and a past session is not a forecast of a future one.