MotiveWave
A native study on Windows, macOS and Linux, including the free Community edition.

What it shows
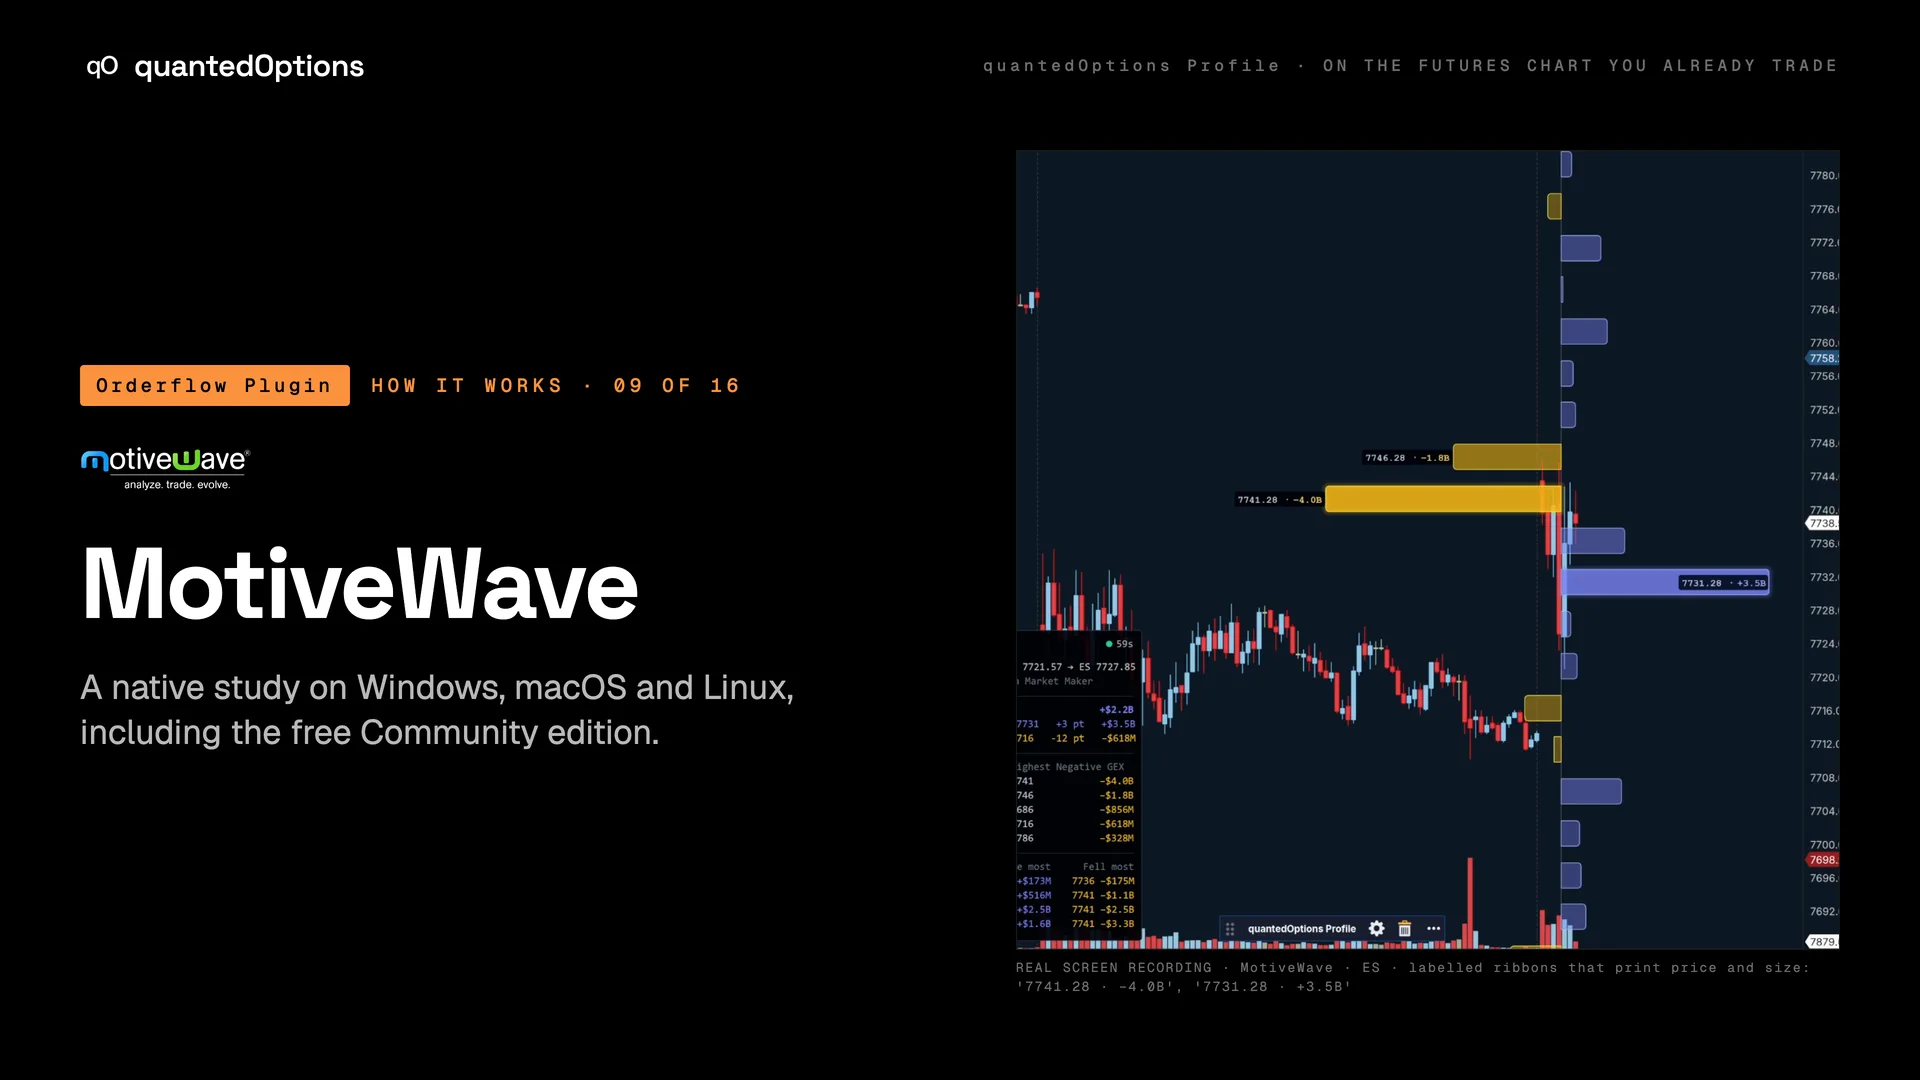
quantedOptions Profile as a native MotiveWave study, on every MotiveWave 7 edition including the free Community edition. The nodes draw as labelled ribbons that print the strike and the size ('7740.46 · +3.4B'), and one key runs several charts at once, each resolving its own book: ES 1-min and NQ 5-min side by side.
What it is built from
The same data, the same settings and the same key as every other platform. On ES and MES: licensed CBOE one-minute data with market-maker positioning, from SPX. On the other families: computed from data consolidated across every US options exchange: open interest and volume.
On this platform
Only on MotiveWave
Windows, macOS and Linux, on every edition including the free Community edition, with labelled ribbons that print strike and size.
- Runs on
- MotiveWave 7 or newer, every edition including the free Community edition
- OS
- Windows · macOS · Linux
Three steps
- 01Download the MotiveWave add-on (one .jar) from your Orderflow Plugin page.
- 02Copy it into the MotiveWave Extensions folder and start MotiveWave.
- 03Choose Study › quantedOptions › quantedOptions Profile, paste your key in the connection settings and leave Source and Conversion on AUTO.
Reading
How to read it
- Each ribbon label reads 'price · size': the futures price of the node and its dollar exposure.
- Watch the largest label: when it moves to another strike, the dominant node has migrated.
- Side by side, the ES panel reads 'CBOE Signed 1-min Market Maker' and the NQ panel reads 'Open-Interest'.
- The study's Guide tab explains the panel line by line.
Settings
What each setting does
| Setting | Options | What it changes |
|---|---|---|
| Show the strike price on labels | on / off (default on) | '7830 · +1.5B' instead of '+1.5B'. |
| Label size / Dark backing behind labels | size (default 12); on / off (default on) | Label font size, and a dark pill behind each label. |
| Study tabs | Connection, Profile, Panel & history, Guide | Connection holds the key and AUTO settings; Profile and Panel & history hold the look; Guide explains the panel. |
| Right-click the study › Edit | Opens the settings again, like any other study. |
Read it with
- Gamma nodes at the strikes — one bar per strike: positive nodes slow price, negative nodes let it through
- Instruments: one key, every family — eS from SPX with CBOE signed market-maker data; every other family its own levels
- The data panel — the regime, the nearest nodes, the top strikes and what changed, in one corner
Good to know
- The Community edition is free, so the platform and your key put the signed market-maker book on an ES chart.
- The same add-on runs natively on macOS, Windows and Linux.
On a real chart
See it happen
MotiveWave · ES and NQ side by side, 2026-08-19: labelled ribbons such as '7740.46 · +3.4B', with the largest node migrating from one strike to the next. One key, each chart resolving its own book.
11 slides
The walk-through, slide by slide
Slide 1 / 11
These pages describe what the displays show and what the data did on the sessions shown. They are not trading advice, and a past session is not a forecast of a future one.