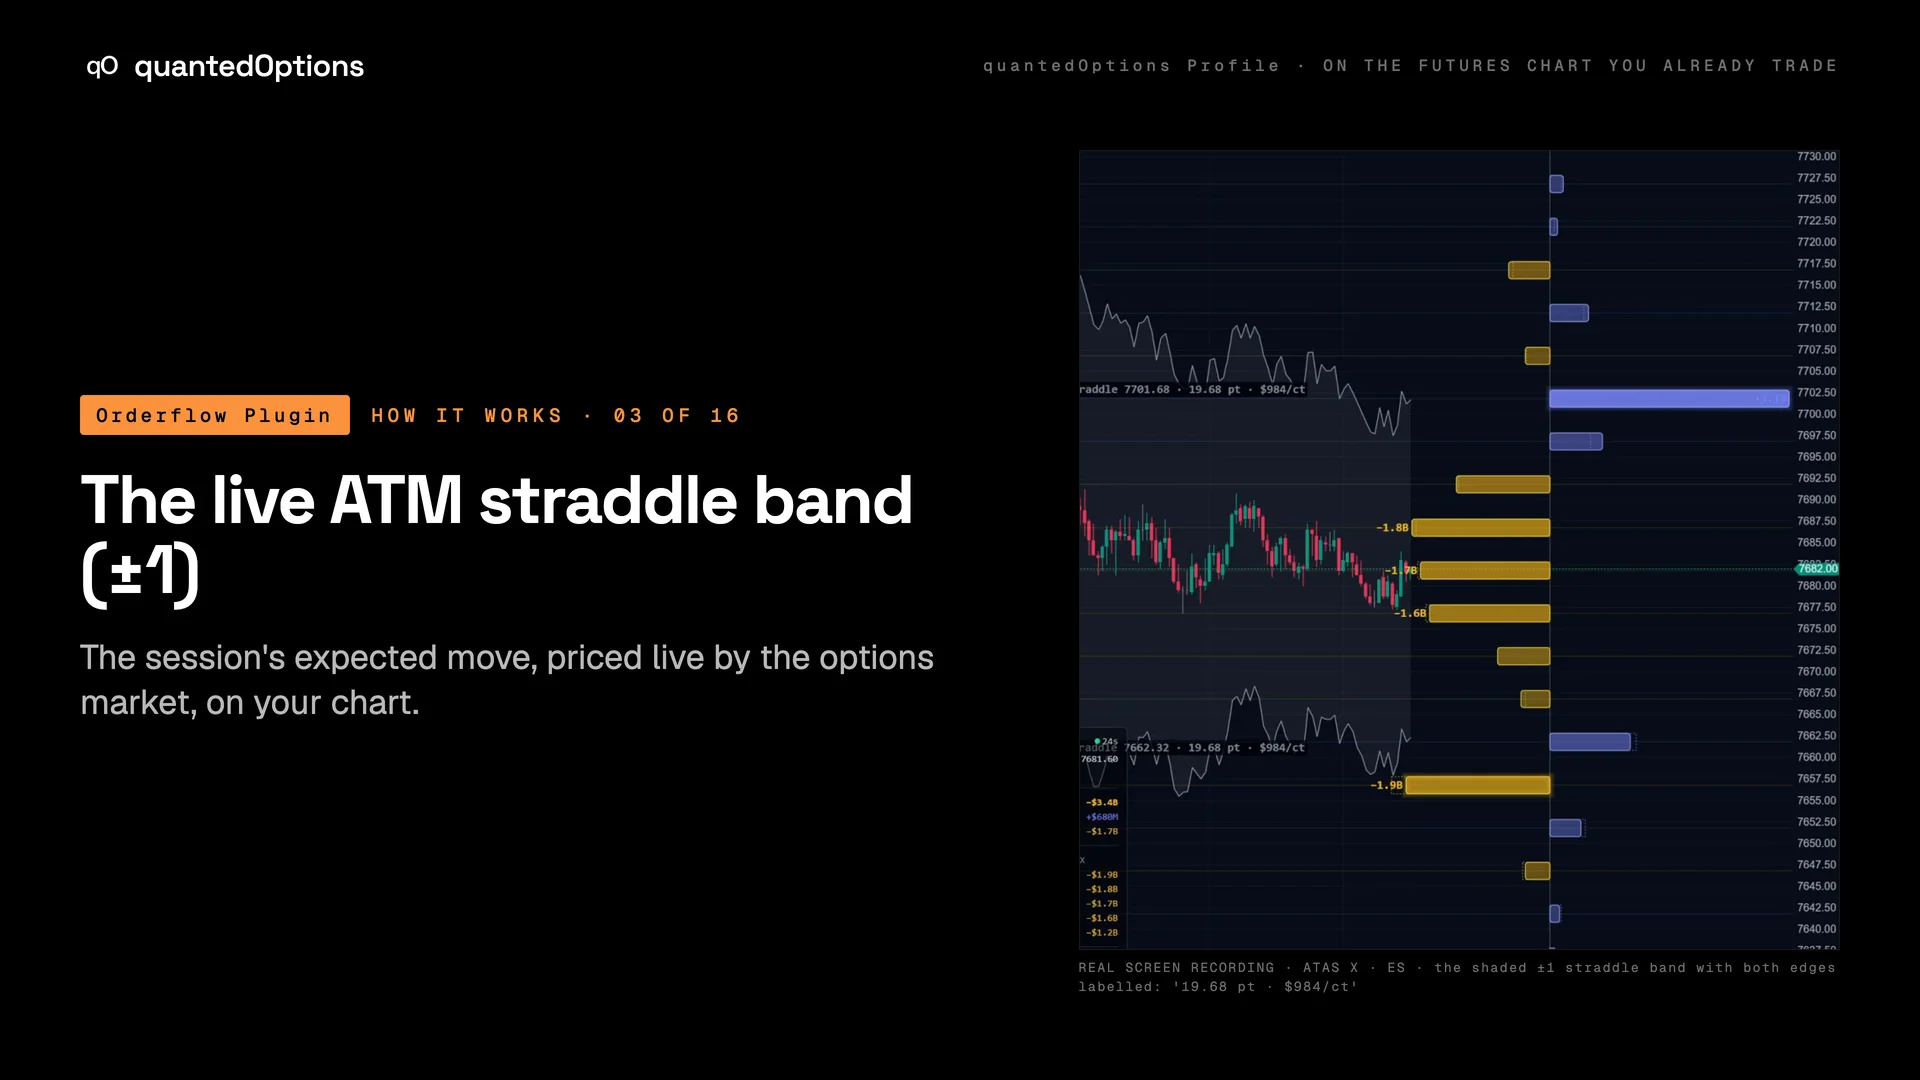
The live ATM straddle band (±1)
The session's expected move, priced live by the options market, on your chart.
What it shows
A shaded band either side of the market, drawn from the live price of the at-the-money straddle: the market's own price for the session's move. Its edges are labelled, and its width prints in points and in dollars for one contract of the future you are trading. It reprices with the market through the session.
What it is built from
The live at-the-money straddle for the expiry on screen, from the same options data as the nodes. On ES and MES: licensed CBOE one-minute data with market-maker positioning, from SPX. On the other families: computed from data consolidated across every US options exchange: open interest and volume.
Reading
How to read it
- Price inside the band is inside the move the options market has priced for the session.
- The band narrows through the day as time value comes out of the straddle.
- A positive node at a band edge puts two readings at one price: the priced move ends where market makers are long gamma.
- Read the width in dollars: it is what the priced move is worth on one contract.
Read it with
- Gamma nodes at the strikes — the nodes inside and outside the band
- The data panel — the nearest node each side, with its distance in points and dollars
Good to know
- The band rides on top of the ladder with its edges labelled, so it stays readable with all four lanes on.
- On NinjaTrader's SuperDOM column the rows inside the band are tinted.
On a real chart
See it happen
On the ES recordings the band is printed on the chart as '+1 straddle' and '−1 straddle', each with its distance in points and in dollars per contract: 19.68 pt / $984 on the ATAS X clip, 28.16 pt / $1,408 on the Quantower clip. Price trades inside the shaded box, and the number shrinks through the day as the straddle loses time value.
10 slides
The walk-through, slide by slide
Slide 1 / 10
These pages describe what the displays show and what the data did on the sessions shown. They are not trading advice, and a past session is not a forecast of a future one.