SPX Surface - Gamma
A heat map of market-maker gamma across price and time, under the candles.
What it shows
Price candles drawn over a coloured grid: the vertical axis is price, the horizontal axis is the trading day 09:30-16:00 ET. Each cell is the market maker's gamma exposure if price were at that level at that time. A white 'Zero' line marks where exposure changes sign, drawn from the current minute forward.
What it is built from
The market maker's book, re-priced across price levels and across the rest of the trading day. 0DTE uses today's expiry; All uses every expiry. Built from licensed CBOE one-minute SPX and VIX data with market-maker positioning, recomputed every minute.
Reading
How to read it
- Positive-colour regions are where market makers would be long gamma: price tends to slow there.
- Negative-colour regions are where they would be short gamma: price tends to travel faster there.
- The white Zero line is the zero gamma line (the gamma flip) projected forward through the day.
- Everything to the right of the current minute is the current book projected forward through the day.
Controls
What each control does
| Control | Options | What it changes |
|---|---|---|
| Metric | Gamma, Vanna, Charm | Which surface is drawn. |
| 0DTE | All | 0DTE, All (default All) | Today's expiry only, or every expiry. |
| Candle interval | 1m, 5m, 10m, 15m, 30m | Candle size; the surface stays the same. |
| Opacity | 0-100% | Heat map strength behind the candles. |
| Range | +/-25, 50, 75, 100, 150, All (default +/-150) | Price window around spot. |
| Hover | - | Shows Strike, time and the exposure value under the cursor. |
Read it with
- SPX Strike Profile — the ladder's dominant strike shows up as the brightest band
- SPX Surface - Charm — gamma says where price slows; charm says which way the drift leans
- SPX Gamma Profile — one vertical slice of the All-expiry gamma surface at the current minute
Good to know
- Colour is scaled within each minute: compare shapes between minutes and read dollar values from the hover.
- Near the close, 0DTE gamma concentrates into a narrow band at the strikes nearest price.
A real session
See it happen
13:12 ET
A positive gamma regime: price sits inside a positive band all session ($6.9B of positive gamma, 32-point range).
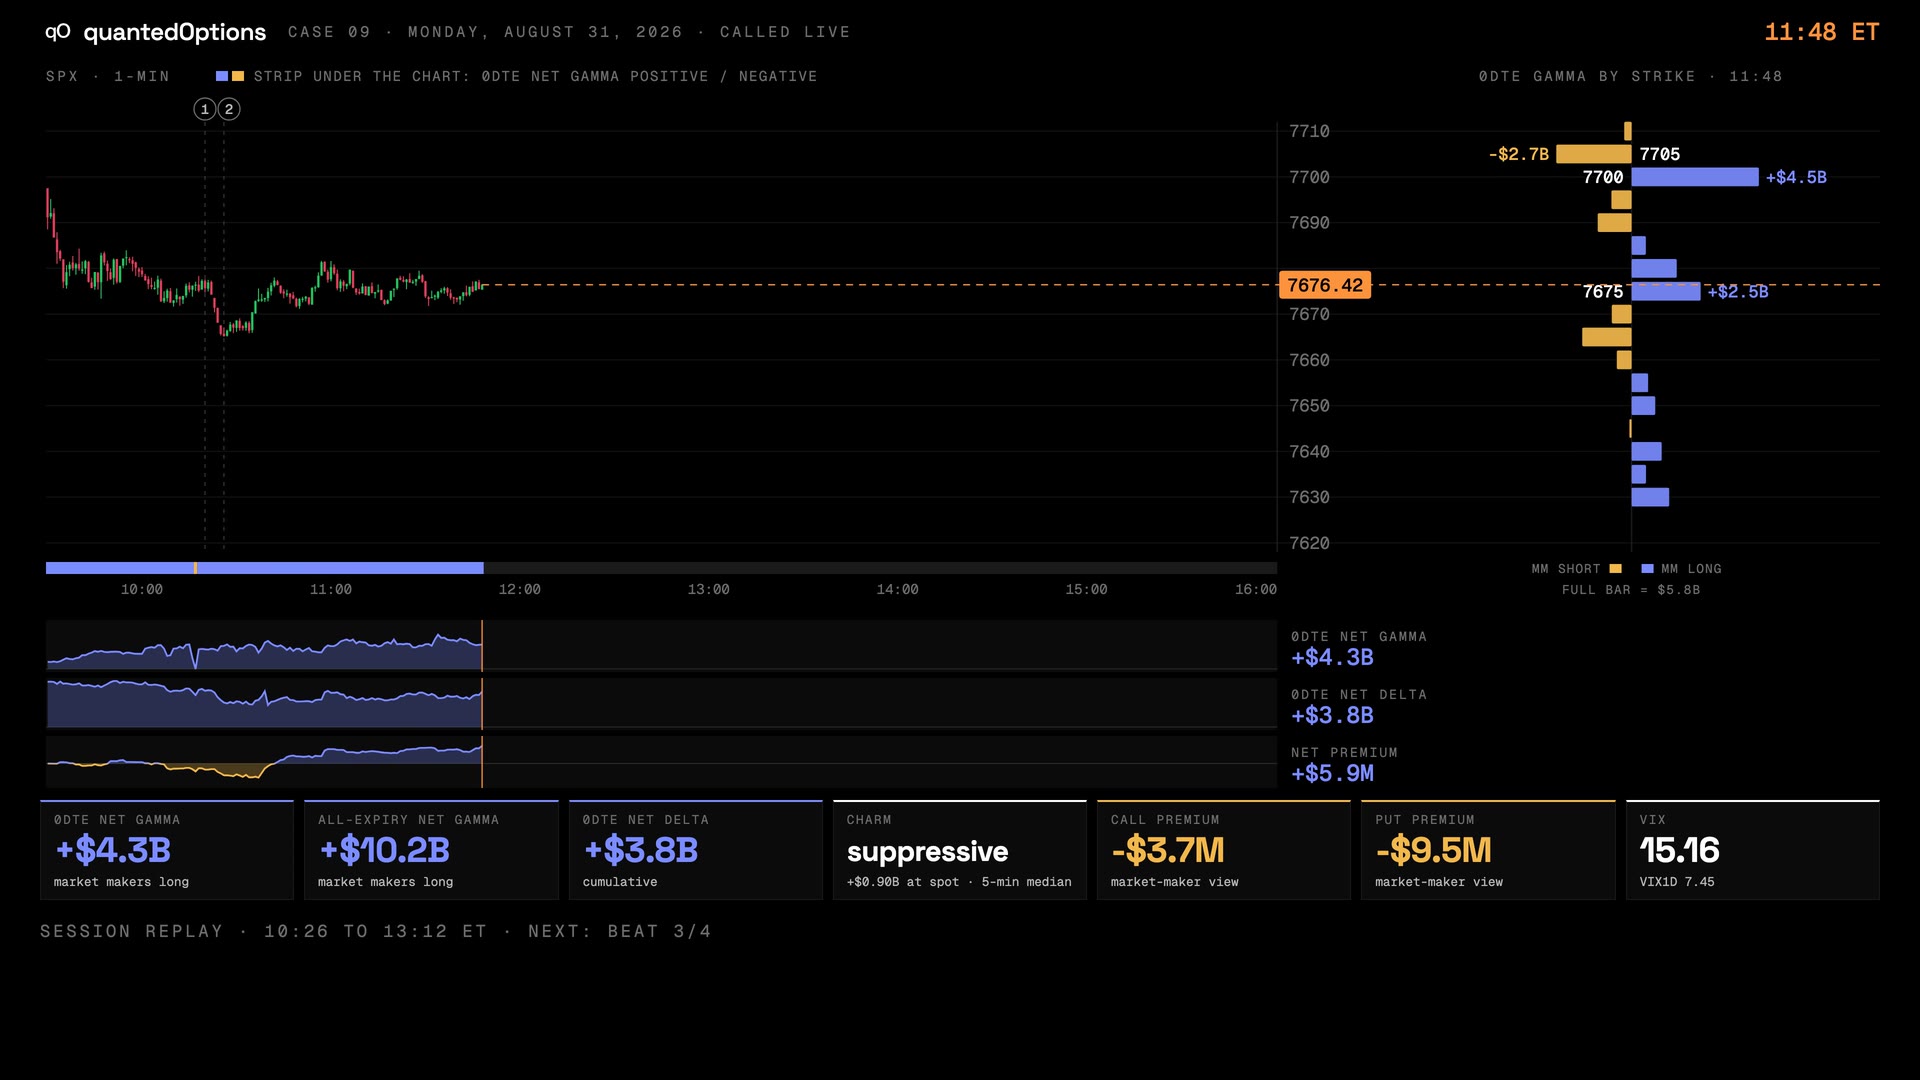
Case 09 · Aug 31, 2026
Stuck in $6.9B of positive gamma mud
11 slides
The walk-through, slide by slide
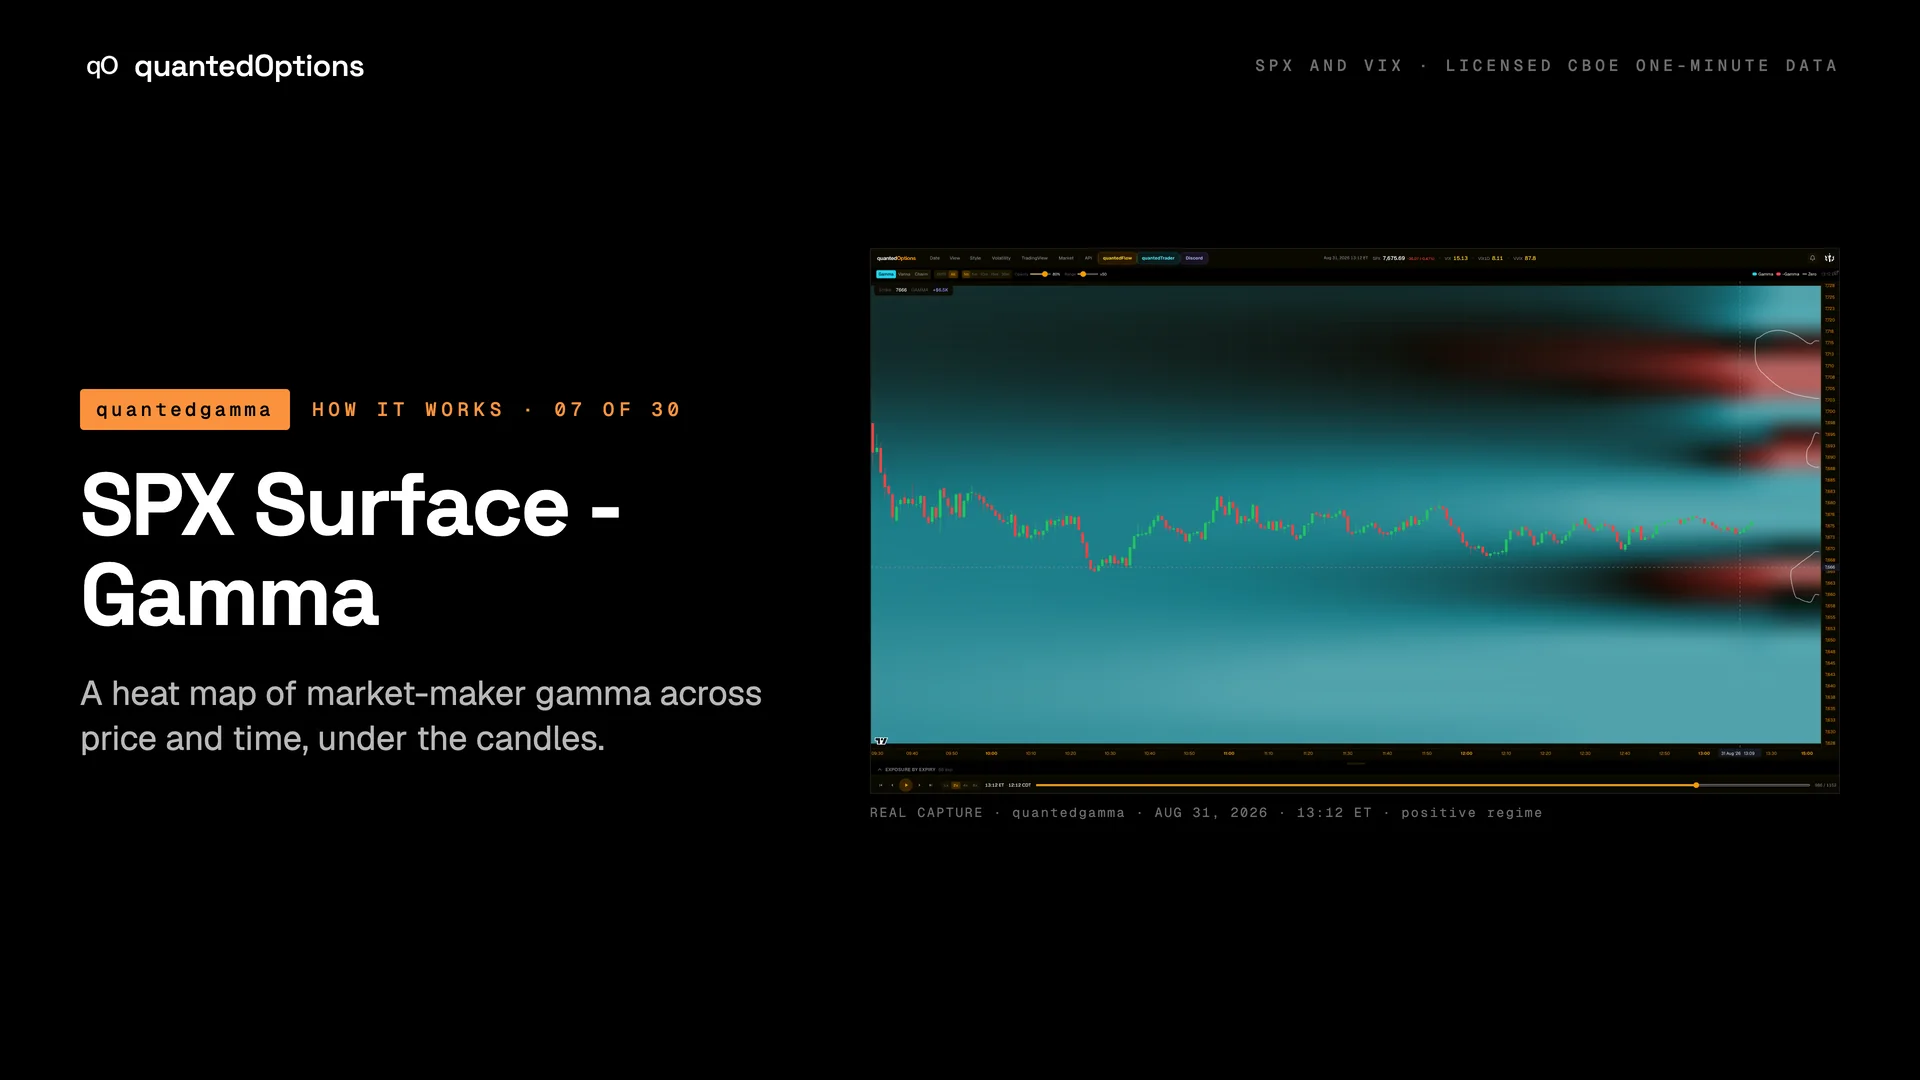
Slide 1 / 11
From the product
Real frames
Shot off the live product, nothing redrawn. Click the right side of a frame for the next one, the left side to go back.
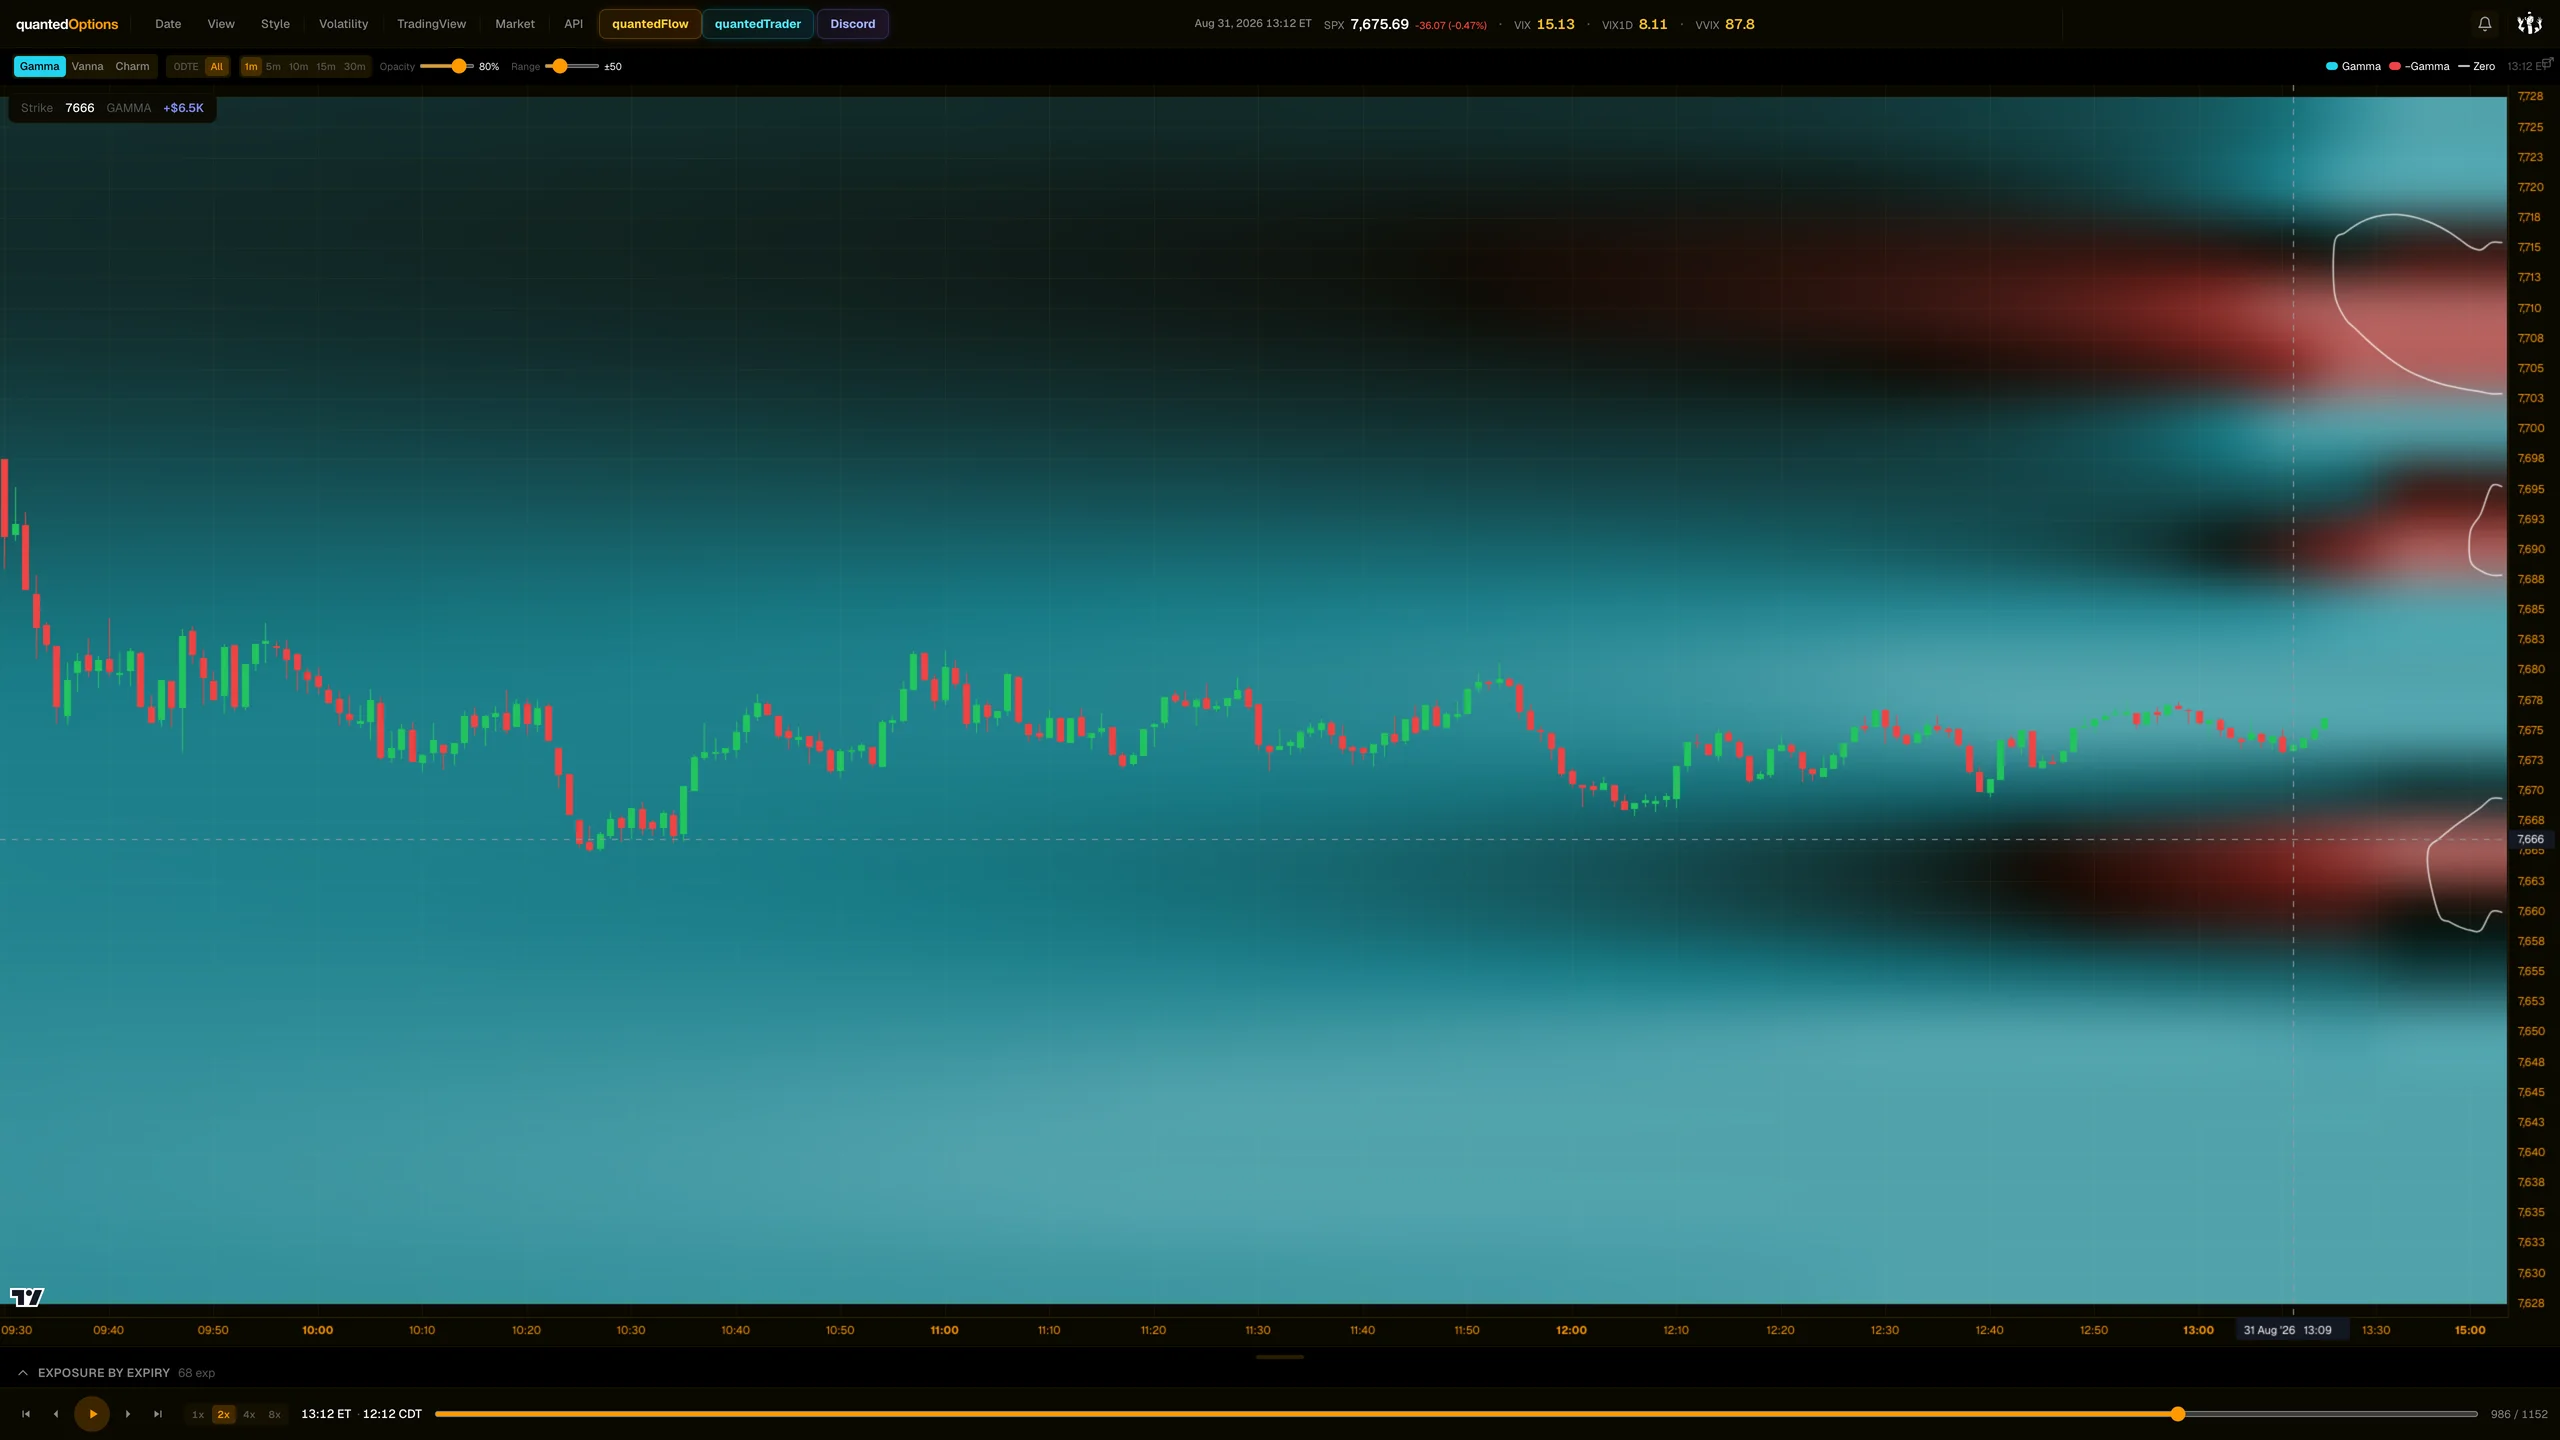
Product frame 1 / 9
These pages describe what the displays show and what the data did on the sessions shown. They are not trading advice, and a past session is not a forecast of a future one.