SPX Gamma Profile
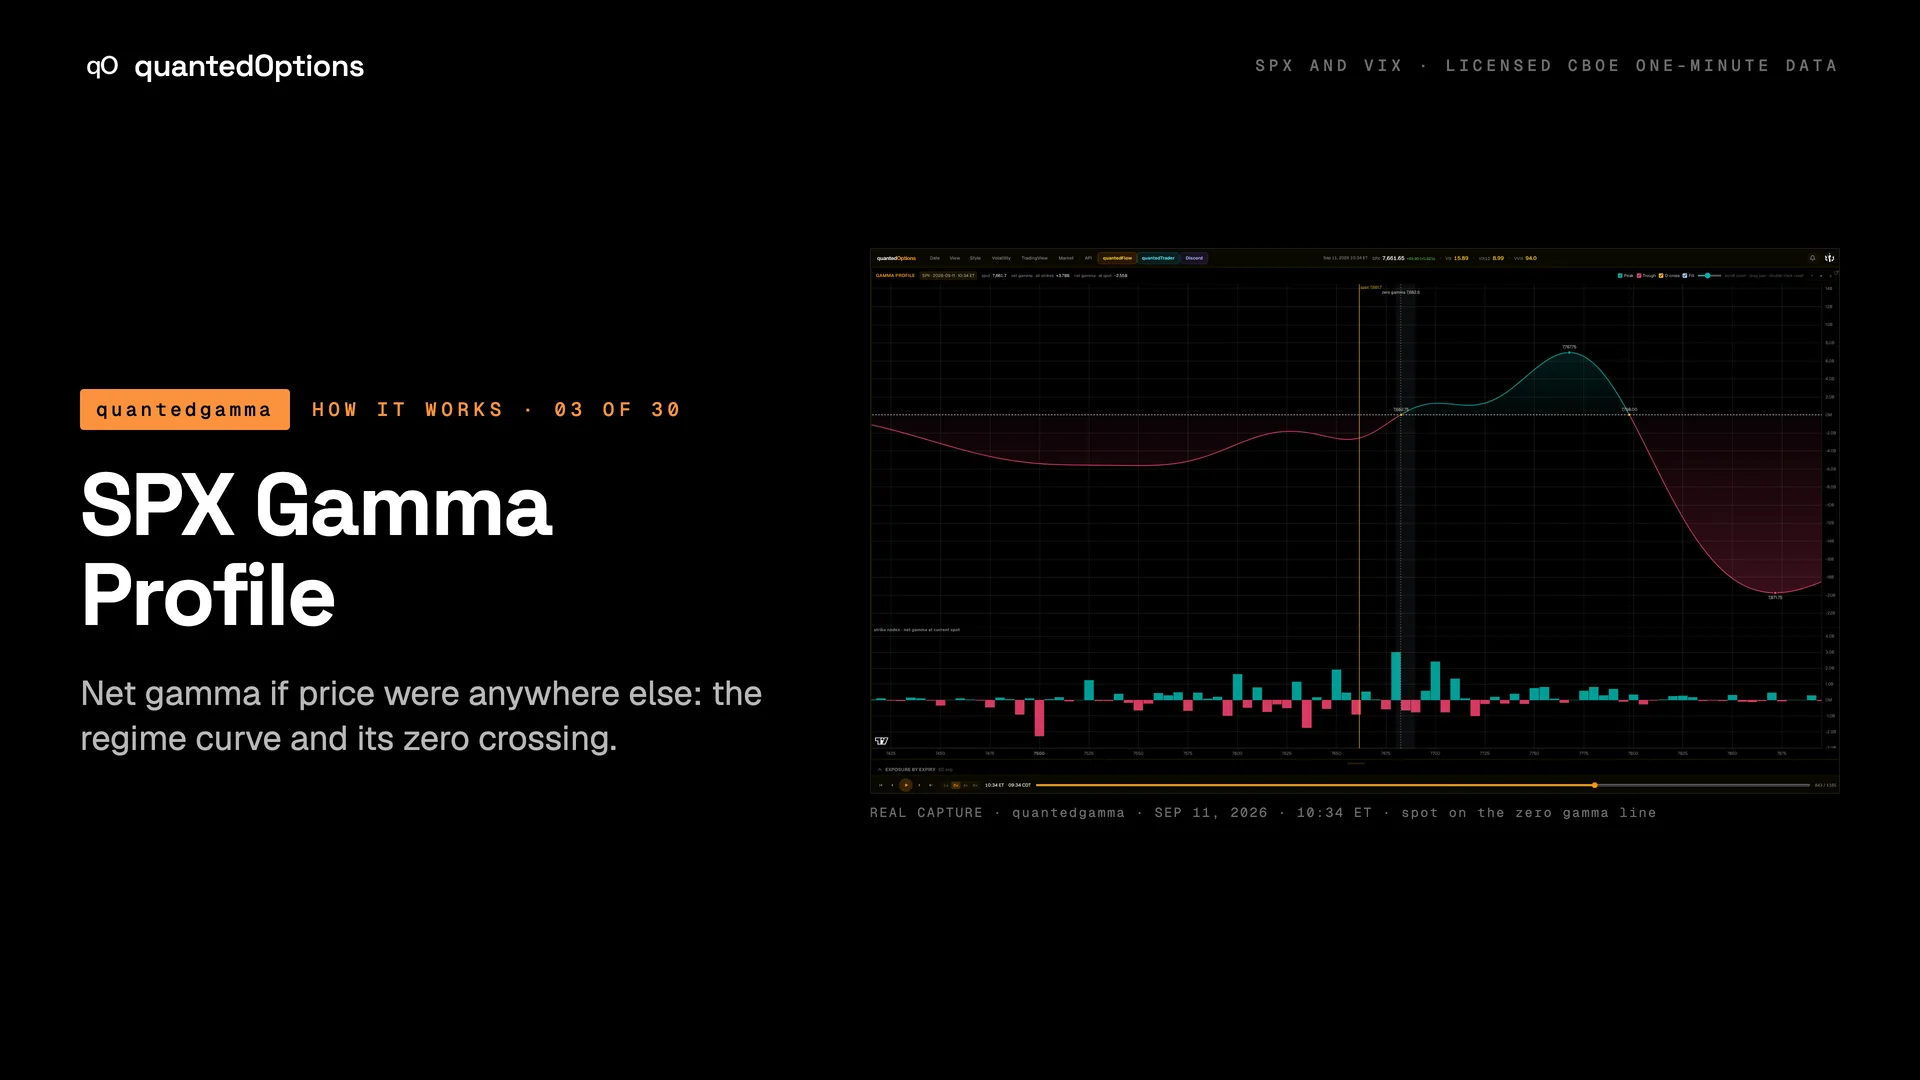
Net gamma if price were anywhere else: the regime curve and its zero crossing.
What it shows
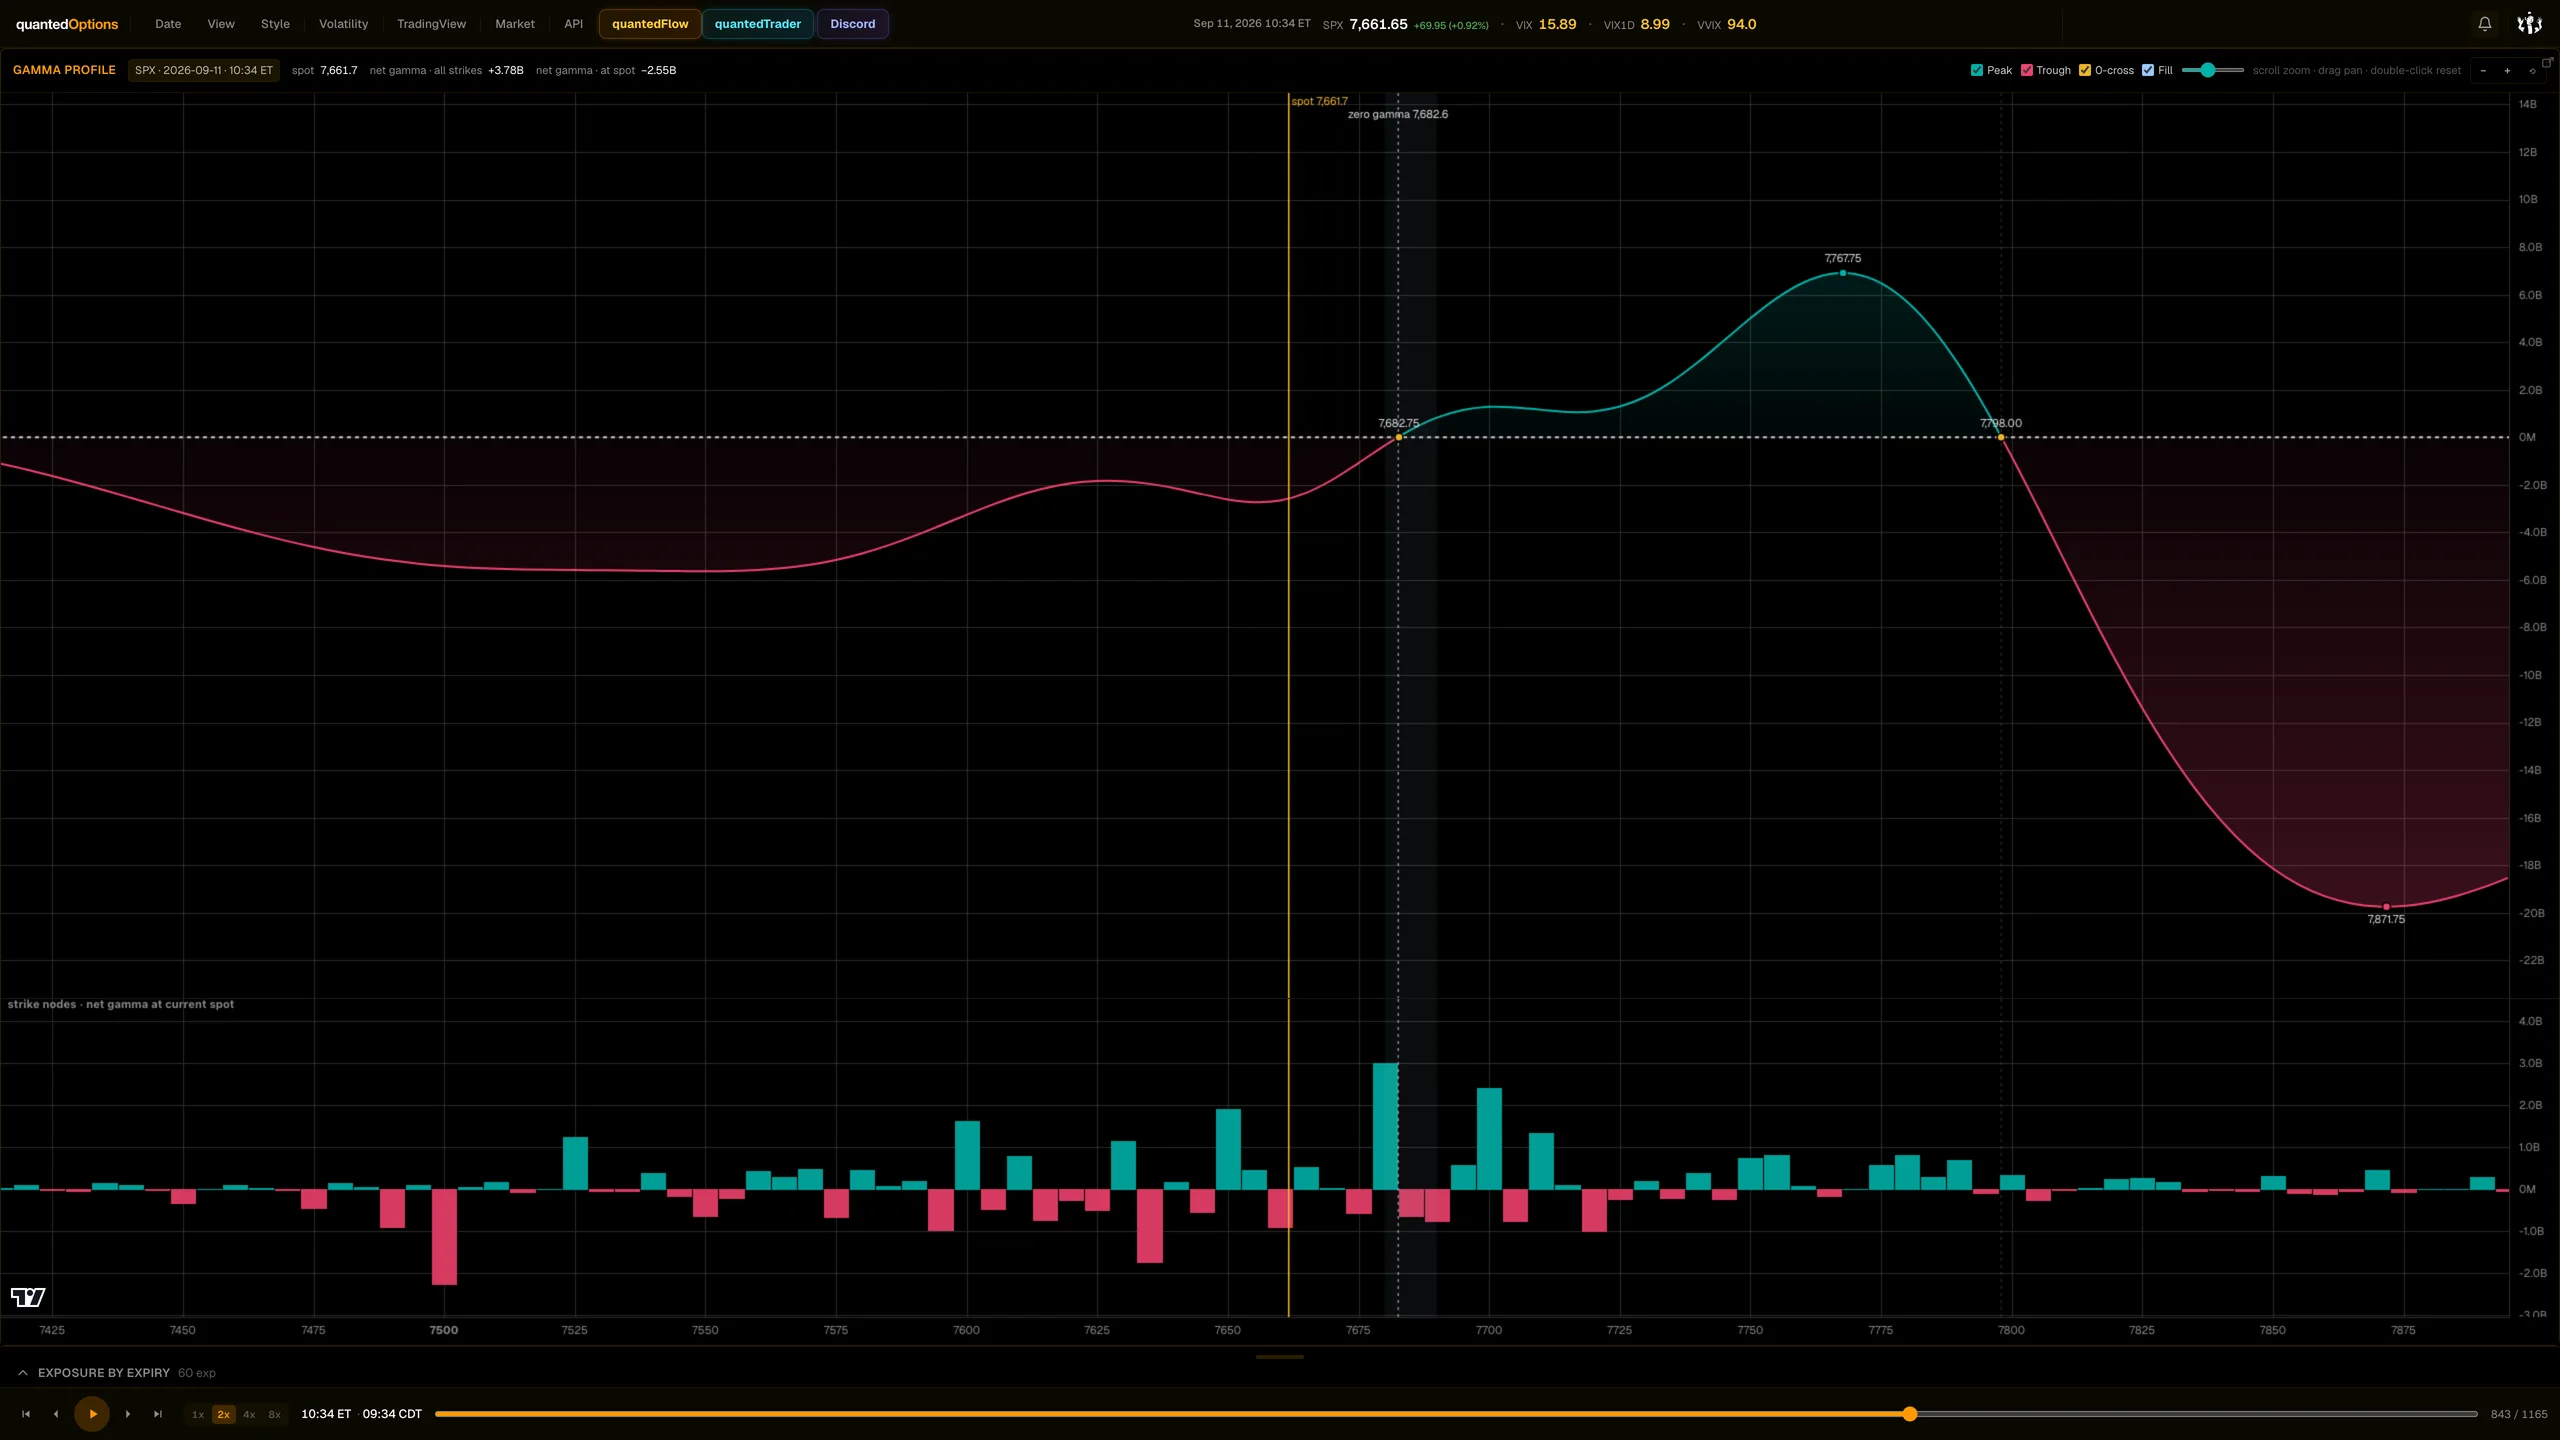
A curve with PRICE on the horizontal axis: all-expiry market-maker net gamma re-priced at every price level, for the current minute. Spot is marked, the zero crossings are labelled 'zero gamma <price>', peaks and troughs are dotted, and a lane underneath shows the per-strike book. The header prints 'net gamma - all strikes' and 'net gamma - at spot'.
What it is built from
All-expiry market-maker gamma, re-priced across a range of price levels for the minute on screen. Built from licensed CBOE one-minute SPX and VIX data with market-maker positioning, recomputed every minute.
Reading
How to read it
- Curve above zero at spot = positive gamma regime (moves get absorbed); below zero = negative gamma regime (moves travel faster and farther).
- The 'zero gamma' label is the zero gamma line, also called the gamma flip: the price where the regime changes.
- A peak is the price where market-maker long gamma is greatest; a trough is where short gamma is greatest.
- Distance from spot to the zero crossing is how much room the current regime has.
Controls
What each control does
| Control | Options | What it changes |
|---|---|---|
| Peak / Trough / 0-cross | checkboxes (default all on) | Show or hide the peak, trough and zero-crossing dots and labels. |
| Fill + intensity slider | on / off, with an intensity slider | Shades the area between the curve and zero. |
| - / + / reset | zoom out, zoom in, reset | Price-axis zoom; also scroll to zoom, drag to pan, double-click to reset. |
Read it with
- SPX Surface - Gamma — this is one time-slice of the All-expiry gamma surface
- Cumulative Net Gamma — that widget shows the regime through time; this one shows it across price
Good to know
- It is all-expiry gamma, so read it beside the 0DTE ladder: today's book and the whole book can carry different signs.
- 'At spot' is the curve's value at the current price; 'all strikes' is the total across the board.
- Live it follows the session; on a replay minute it shows that minute's curve.
A real session
See it happen
10:34 ET
CPI morning: spot sitting on the zero gamma line, 'one push from negative gamma'. At the 10:47 low 0DTE net gamma was still +$1.2B.
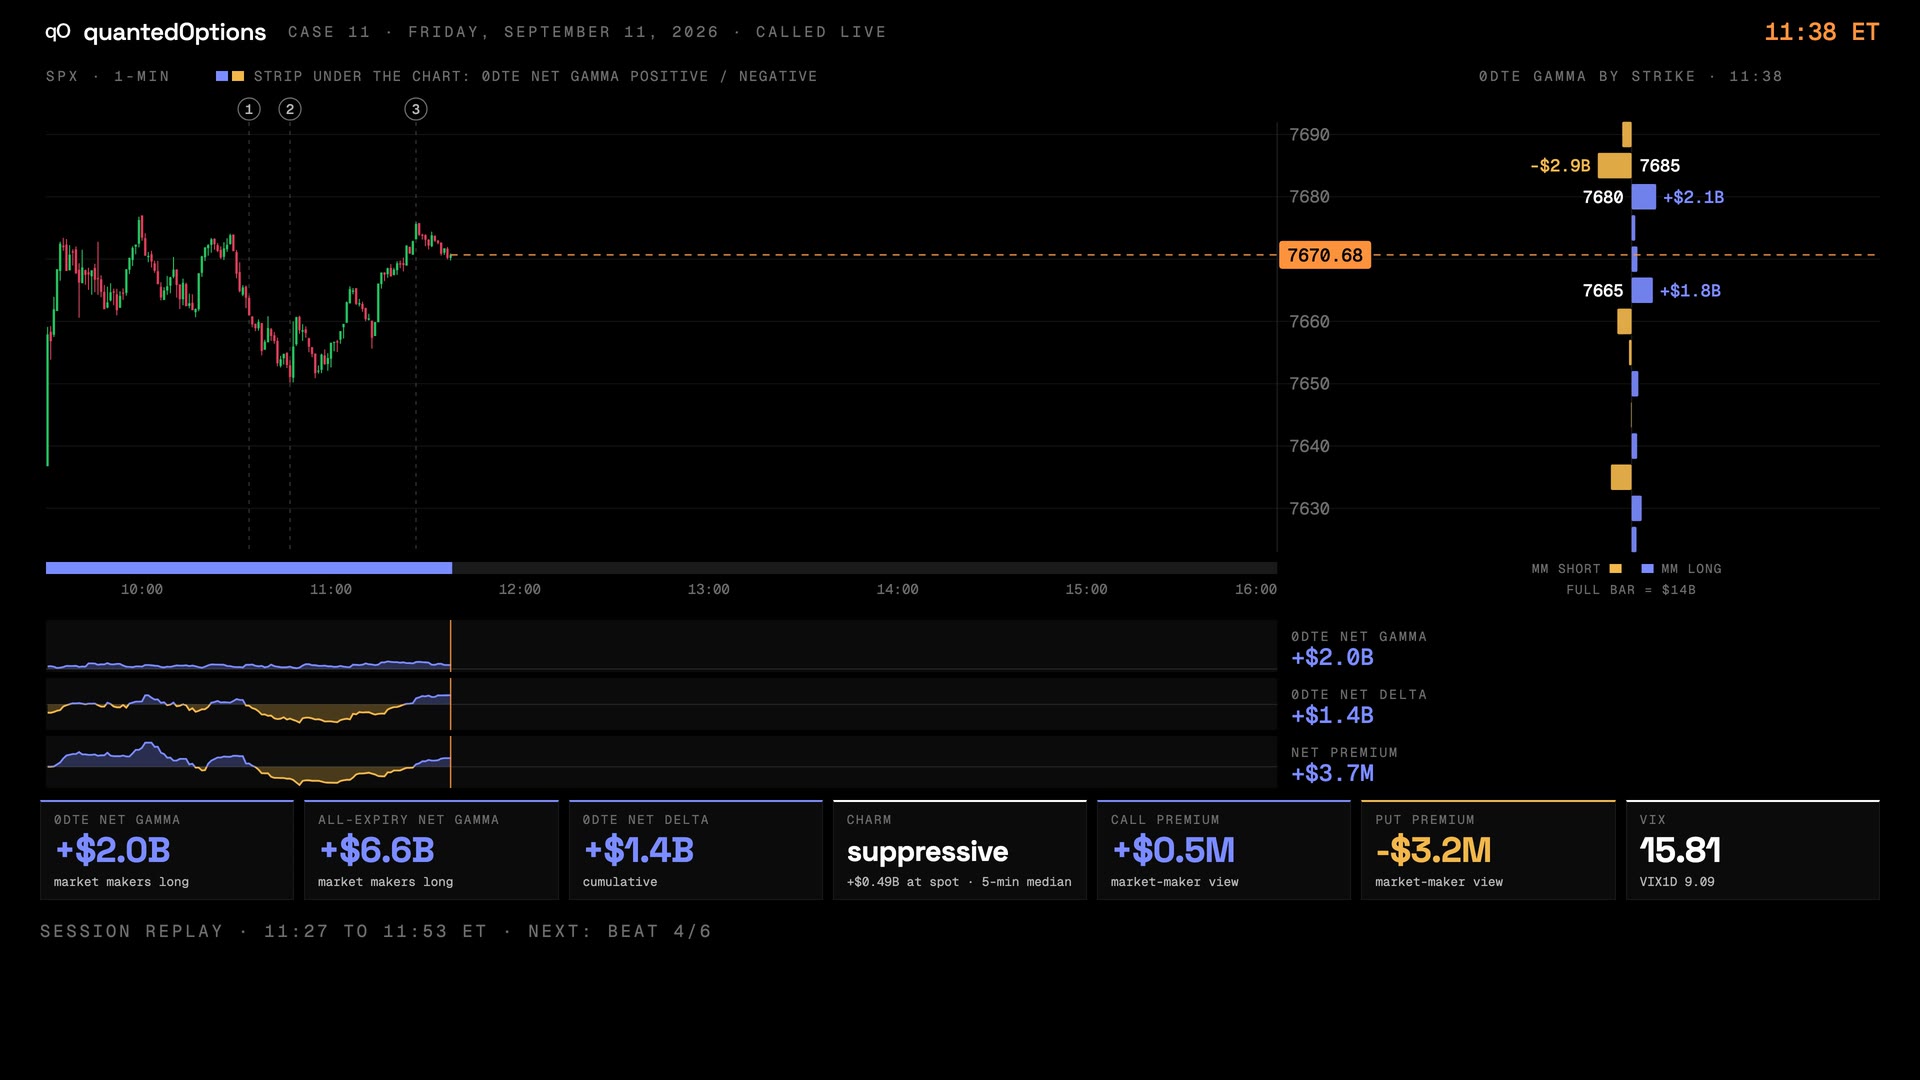
Case 11 · Sep 11, 2026
CPI morning on the zero gamma line, and the dominant upper strike again
10 slides
The walk-through, slide by slide
Slide 1 / 10
From the product
Real frames
Shot off the live product, nothing redrawn. Click the right side of a frame for the next one, the left side to go back.
Product frame 1 / 3
These pages describe what the displays show and what the data did on the sessions shown. They are not trading advice, and a past session is not a forecast of a future one.