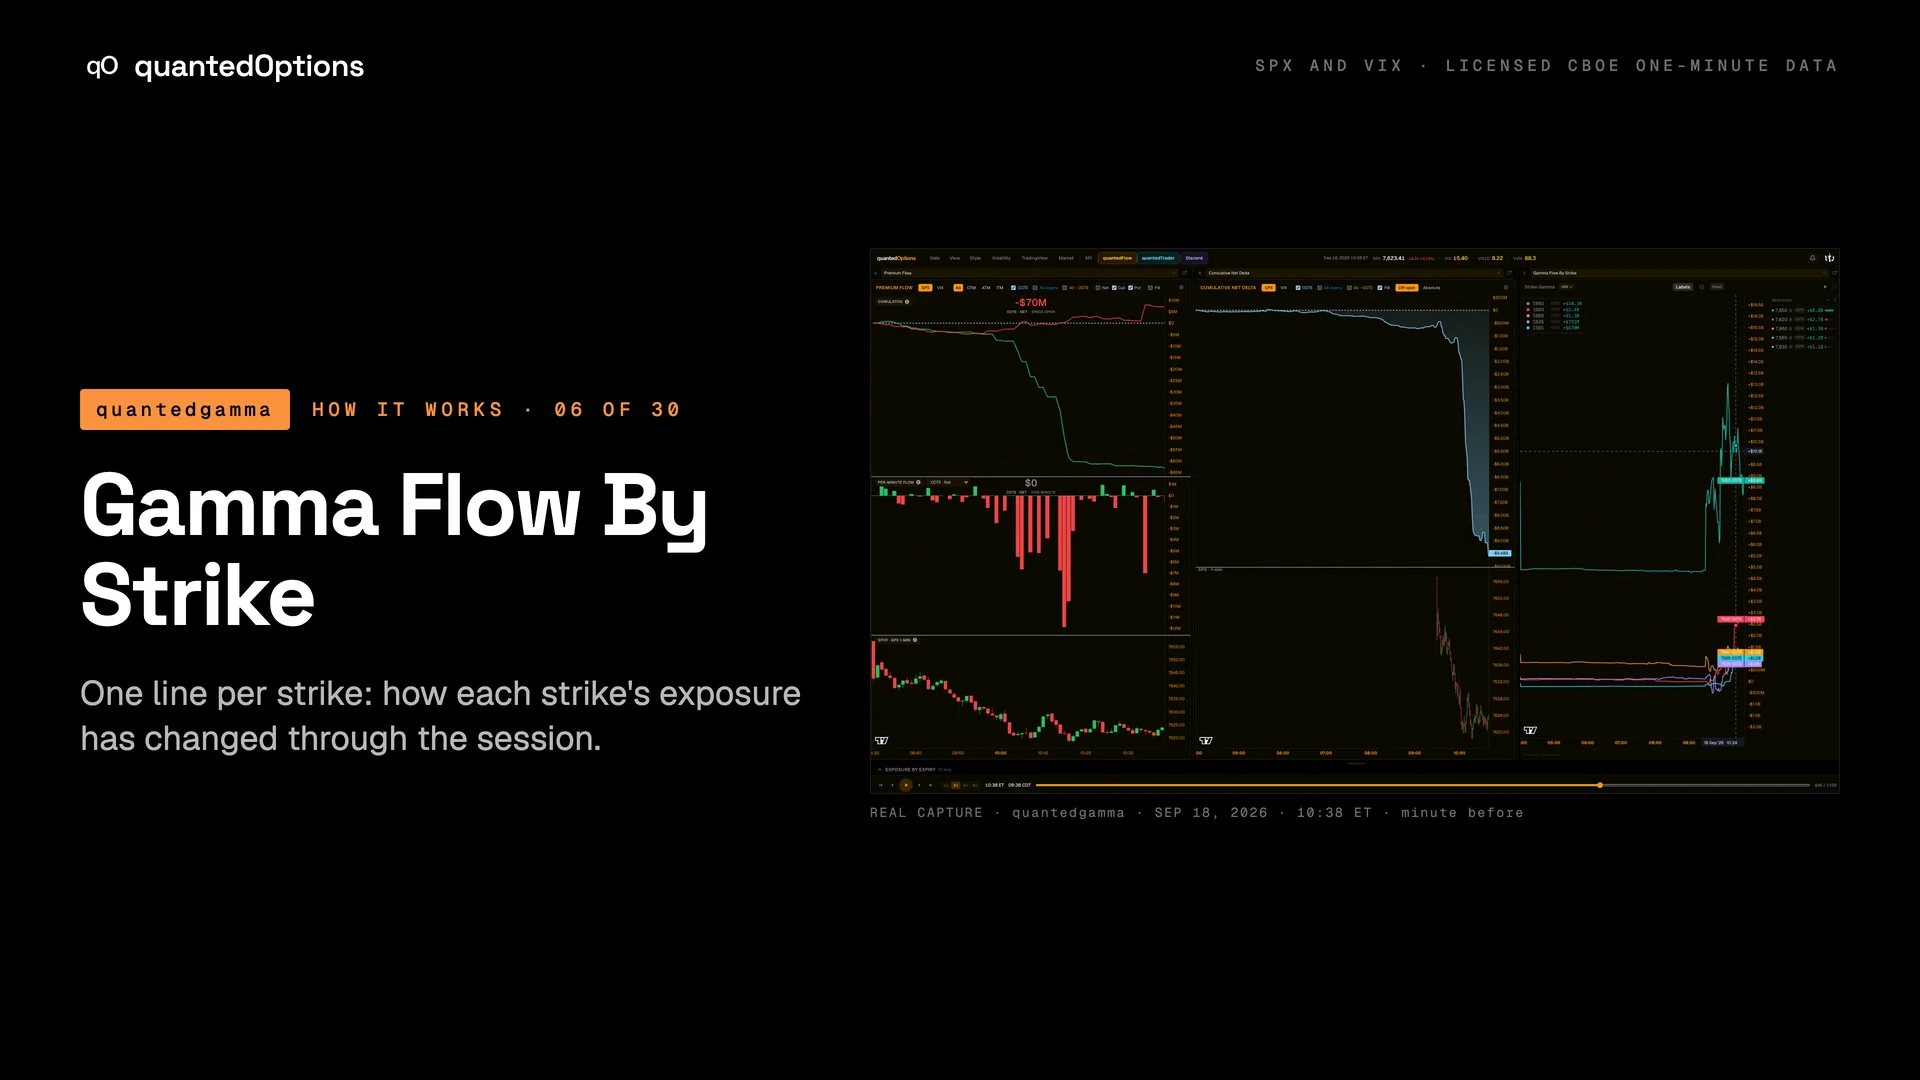
Gamma Flow By Strike
One line per strike: how each strike's exposure has changed through the session.
What it shows
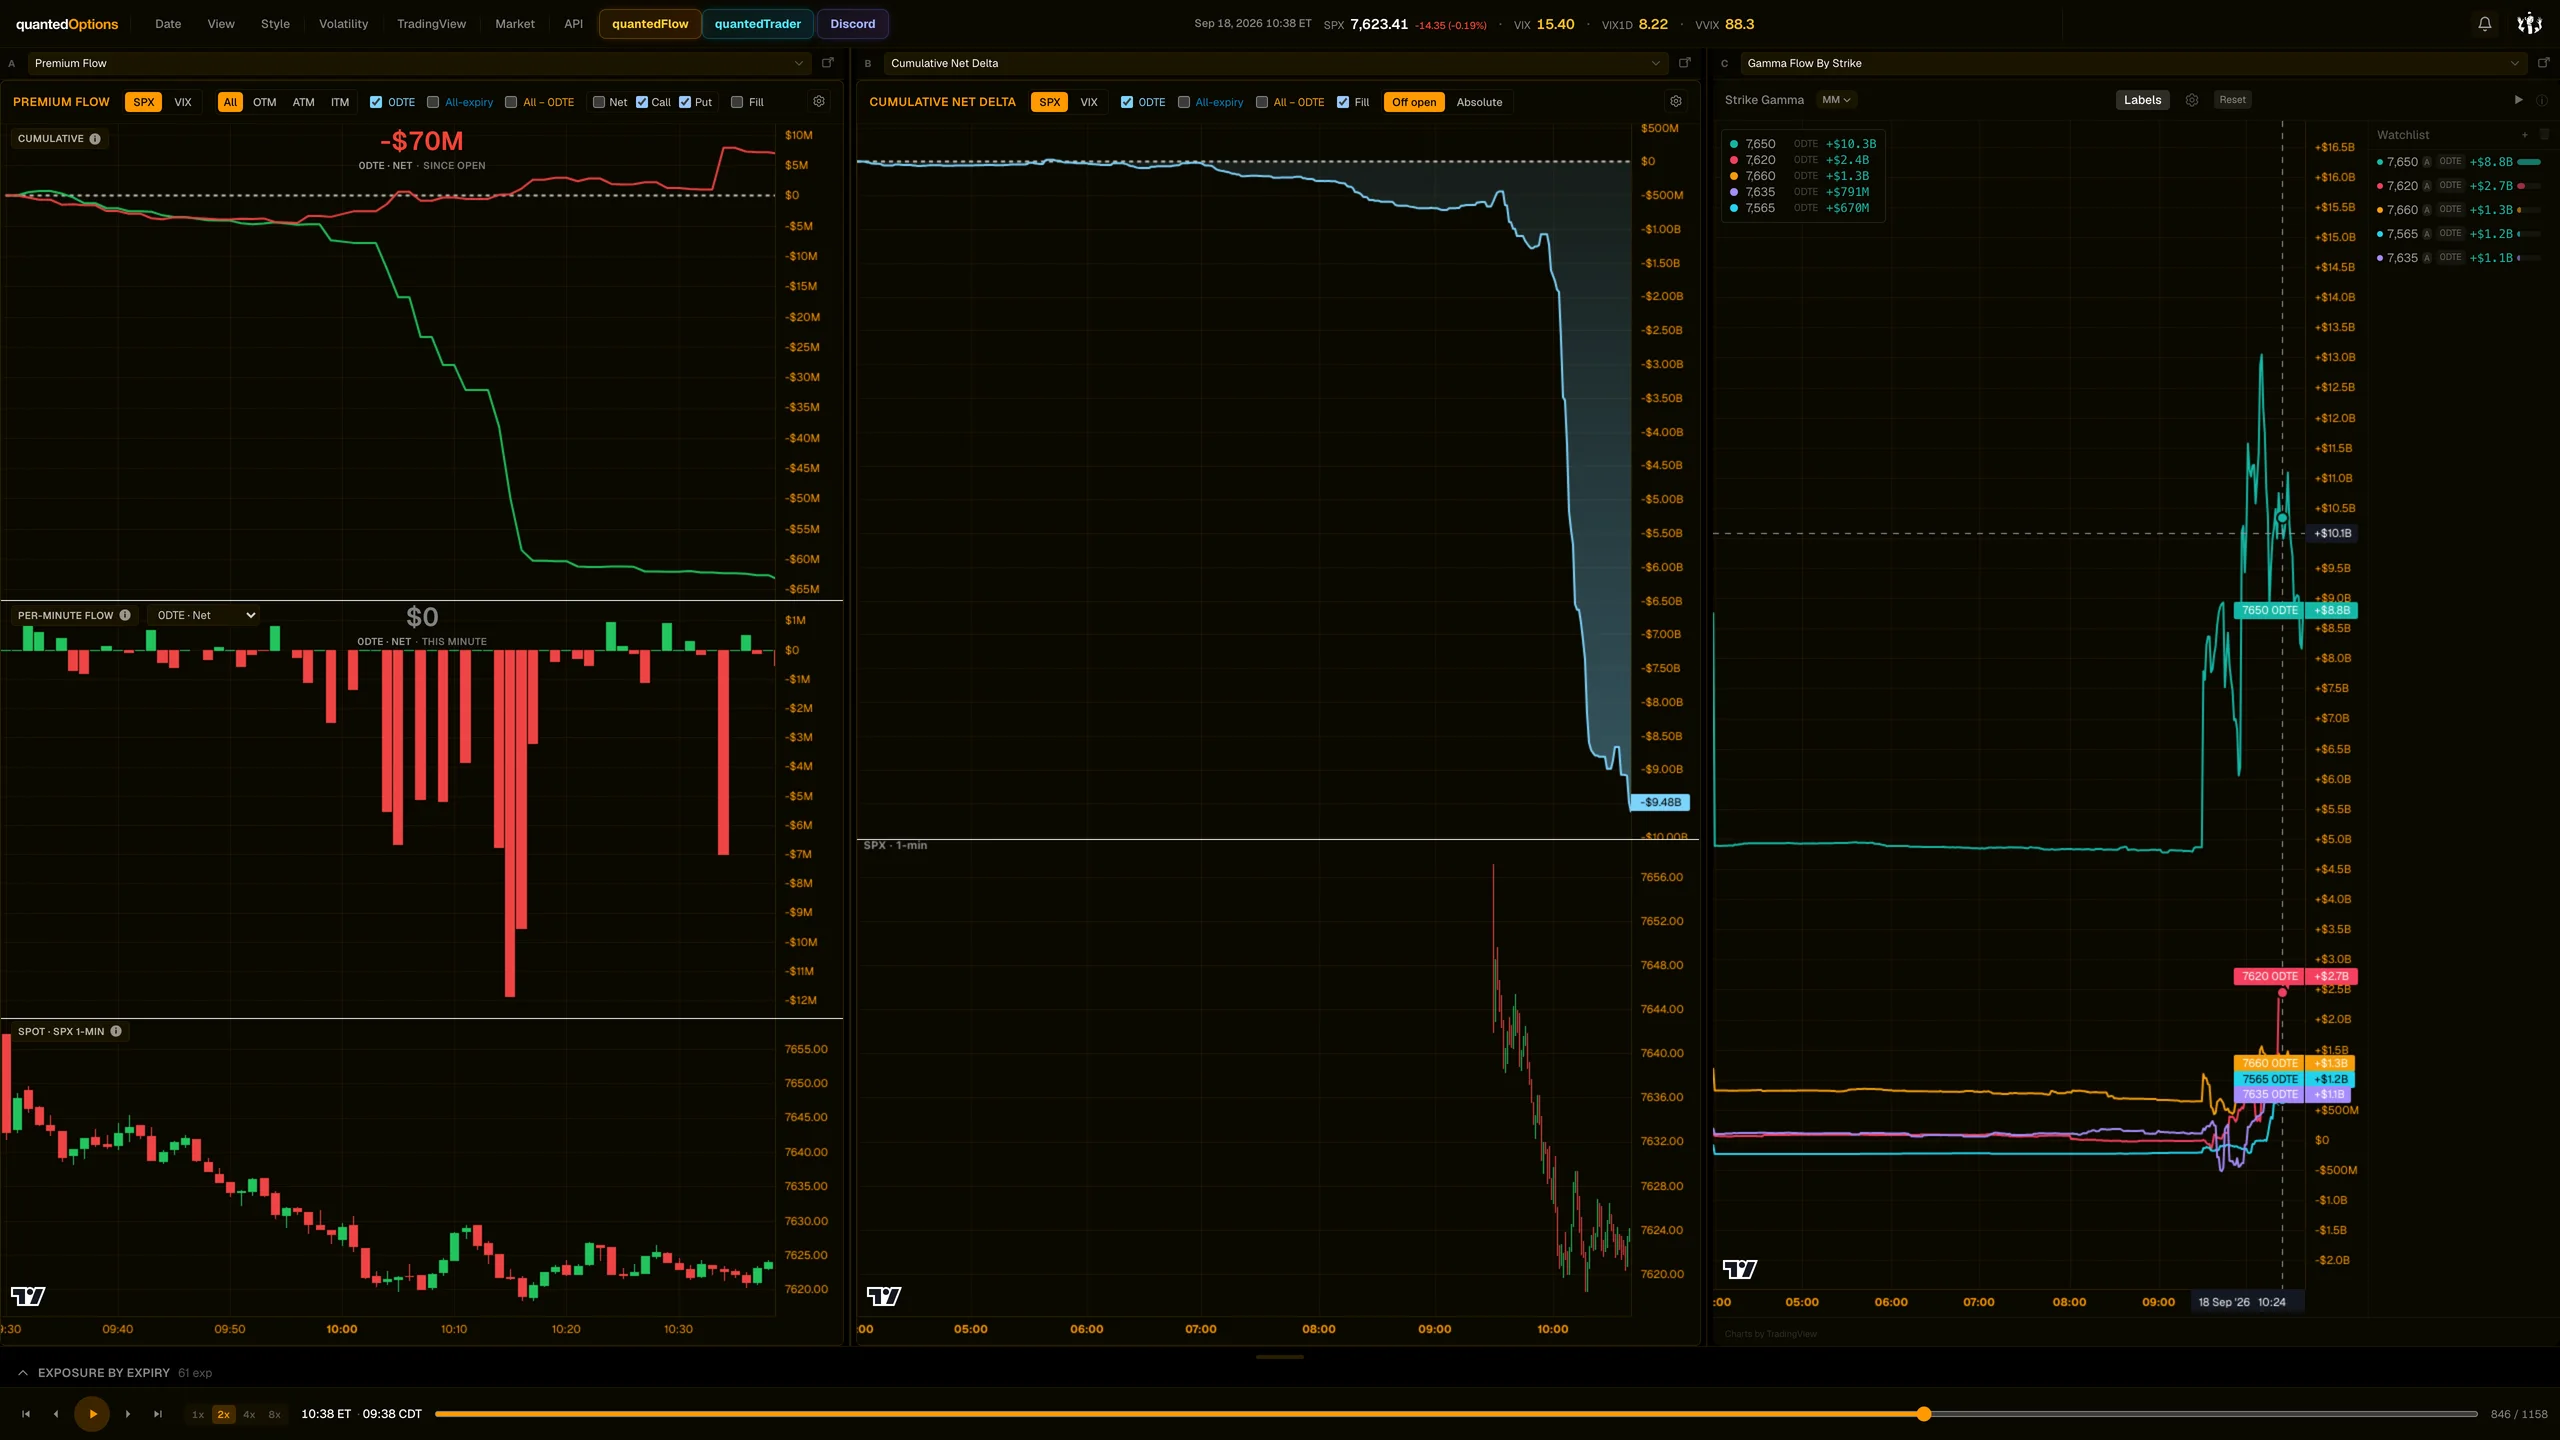
A line chart of market-maker exposure over time for a watchlist of strikes. The top five positive gamma strikes are tracked automatically and refresh every minute; you can add any strike by clicking a bar on the Strike Profile or with + in the watchlist.
What it is built from
Each tracked strike's market-maker exposure, minute by minute. Built from licensed CBOE one-minute SPX and VIX data with market-maker positioning, recomputed every minute.
Reading
How to read it
- A line stepping up means market makers are adding long options at that strike: the strike is being built.
- A line collapsing toward zero means the position is being closed or has rolled off.
- Several lines rising together above price is the 'structure building overhead' picture from the bullish case studies.
- The watchlist on the right ranks the tracked strikes by their current value.
Controls
What each control does
| Control | Options | What it changes |
|---|---|---|
| Metric | Gamma, Vanna, Charm | Which exposure is plotted (title reads 'Strike Gamma' etc.). |
| Auto | button | Re-seeds the watchlist with the top 5 positive gamma strikes. |
| Watchlist + / search / Clear all | strike search, expiry tabs | Add or remove strikes; hide or show the watchlist. |
| Chart settings | Line Style, Line Width, Crosshair, Point markers, Reset | How the chart looks; 'Reset zoom to full day' restores the time axis. |
Read it with
- Premium Flow + Cumulative Net Delta — the three-panel flow page
- SPX Strike Profile — click a bar there to send a strike here
Good to know
- Play the session forward on the replay bar and the lines draw as you go.
- Auto-tracked strikes follow the top five, so lines can join and leave the chart.
- Gamma grows near the money and near expiry, so a line also rises as price moves toward the strike or the close gets nearer.
A real session
See it happen
10:39 ET
7650 at +$8.8B at 10:38 is gone from the top of the board at 10:39: the line drops in one step.
11 slides
The walk-through, slide by slide
Slide 1 / 11
From the product
Real frames
Shot off the live product, nothing redrawn. Click the right side of a frame for the next one, the left side to go back.
Product frame 1 / 4
These pages describe what the displays show and what the data did on the sessions shown. They are not trading advice, and a past session is not a forecast of a future one.