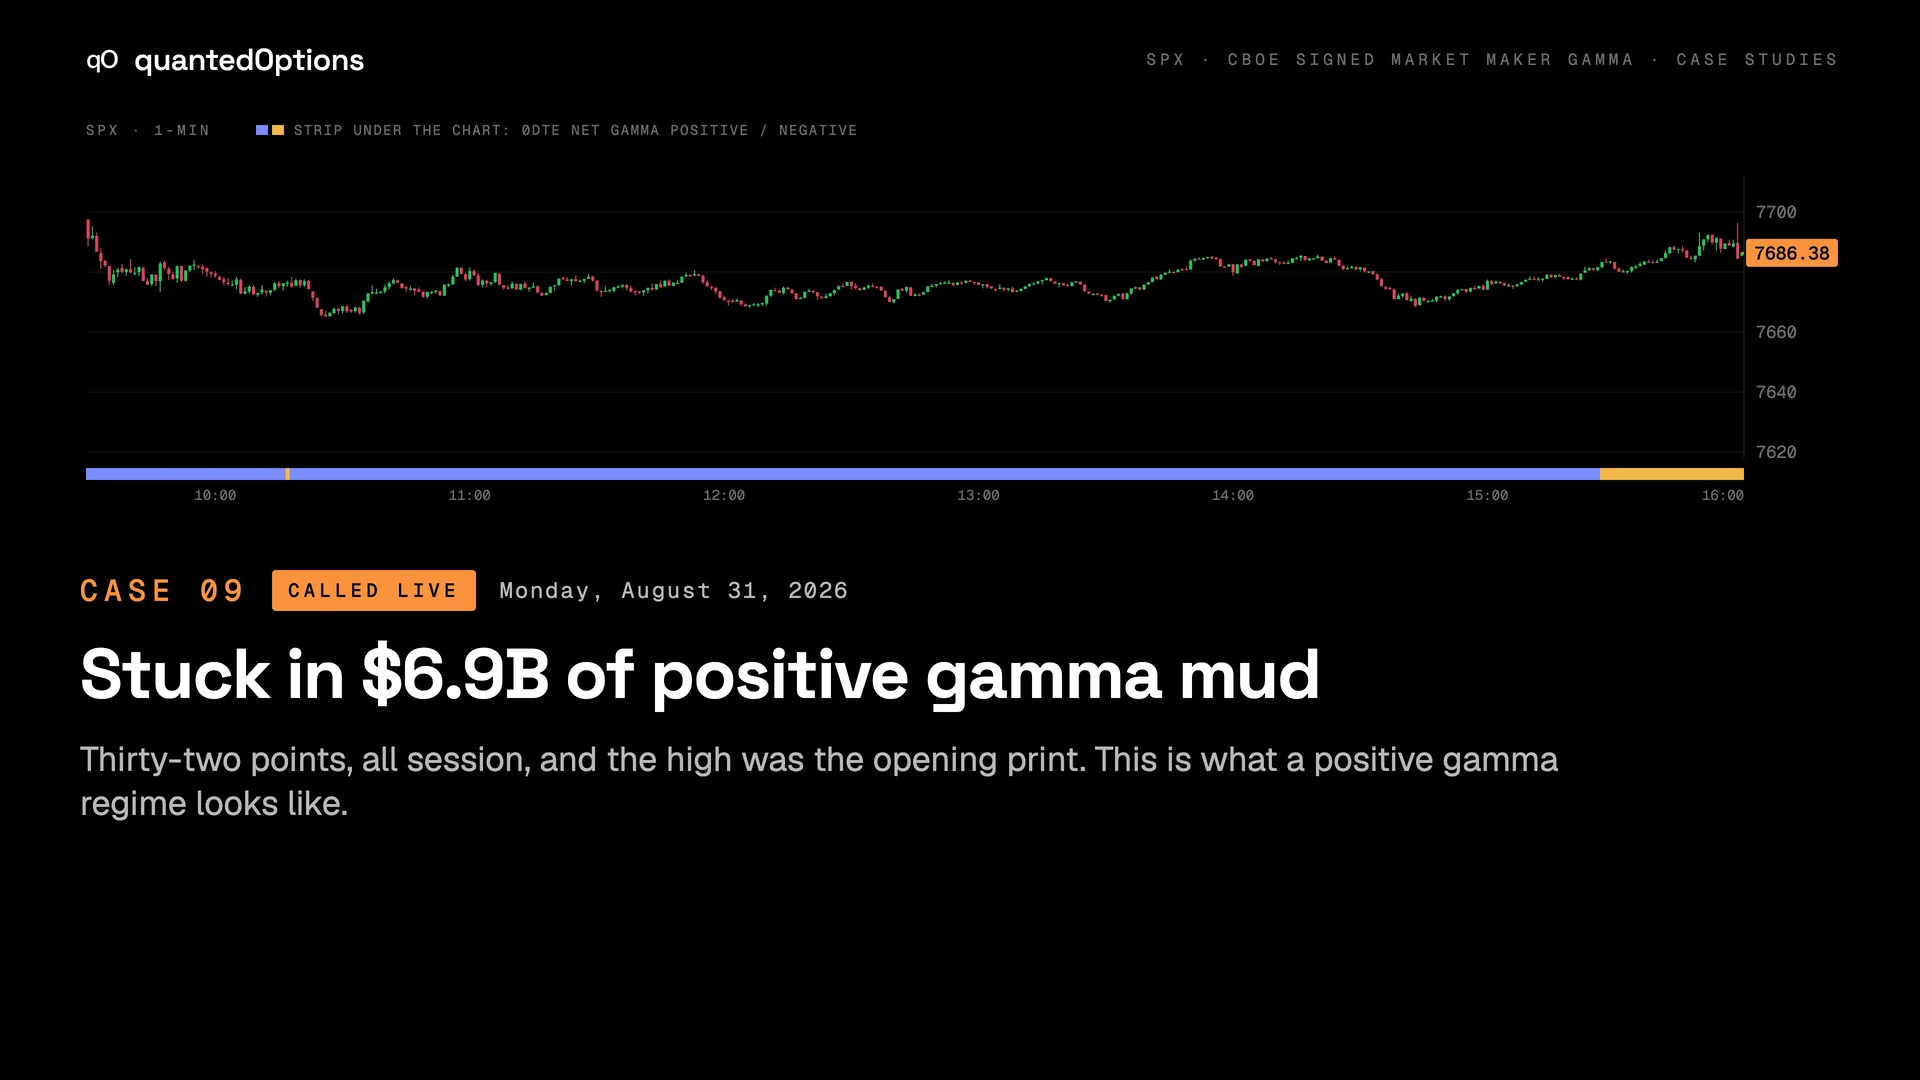
Stuck in $6.9B of positive gamma mud
Thirty-two points, all session, and the high was the opening print. This is what a positive gamma regime looks like.
- SPX open
- 7,697.52
- High
- 7,697.52
- Low
- 7,665.06
- Close
- 7,686.38
- 0DTE net gamma positive
- 95%
- All-expiry net gamma positive
- 99%
- VIX open → close
- 15.28 → 14.95
- VIX high
- 15.47
09:30 ET
10:26 ET
of the session's minutes
of the session's minutes
The positive gamma regime
The story
- 0DTE net gamma positive 95% of minutes, all-expiry 99%. VIX 15.3 to 14.9.
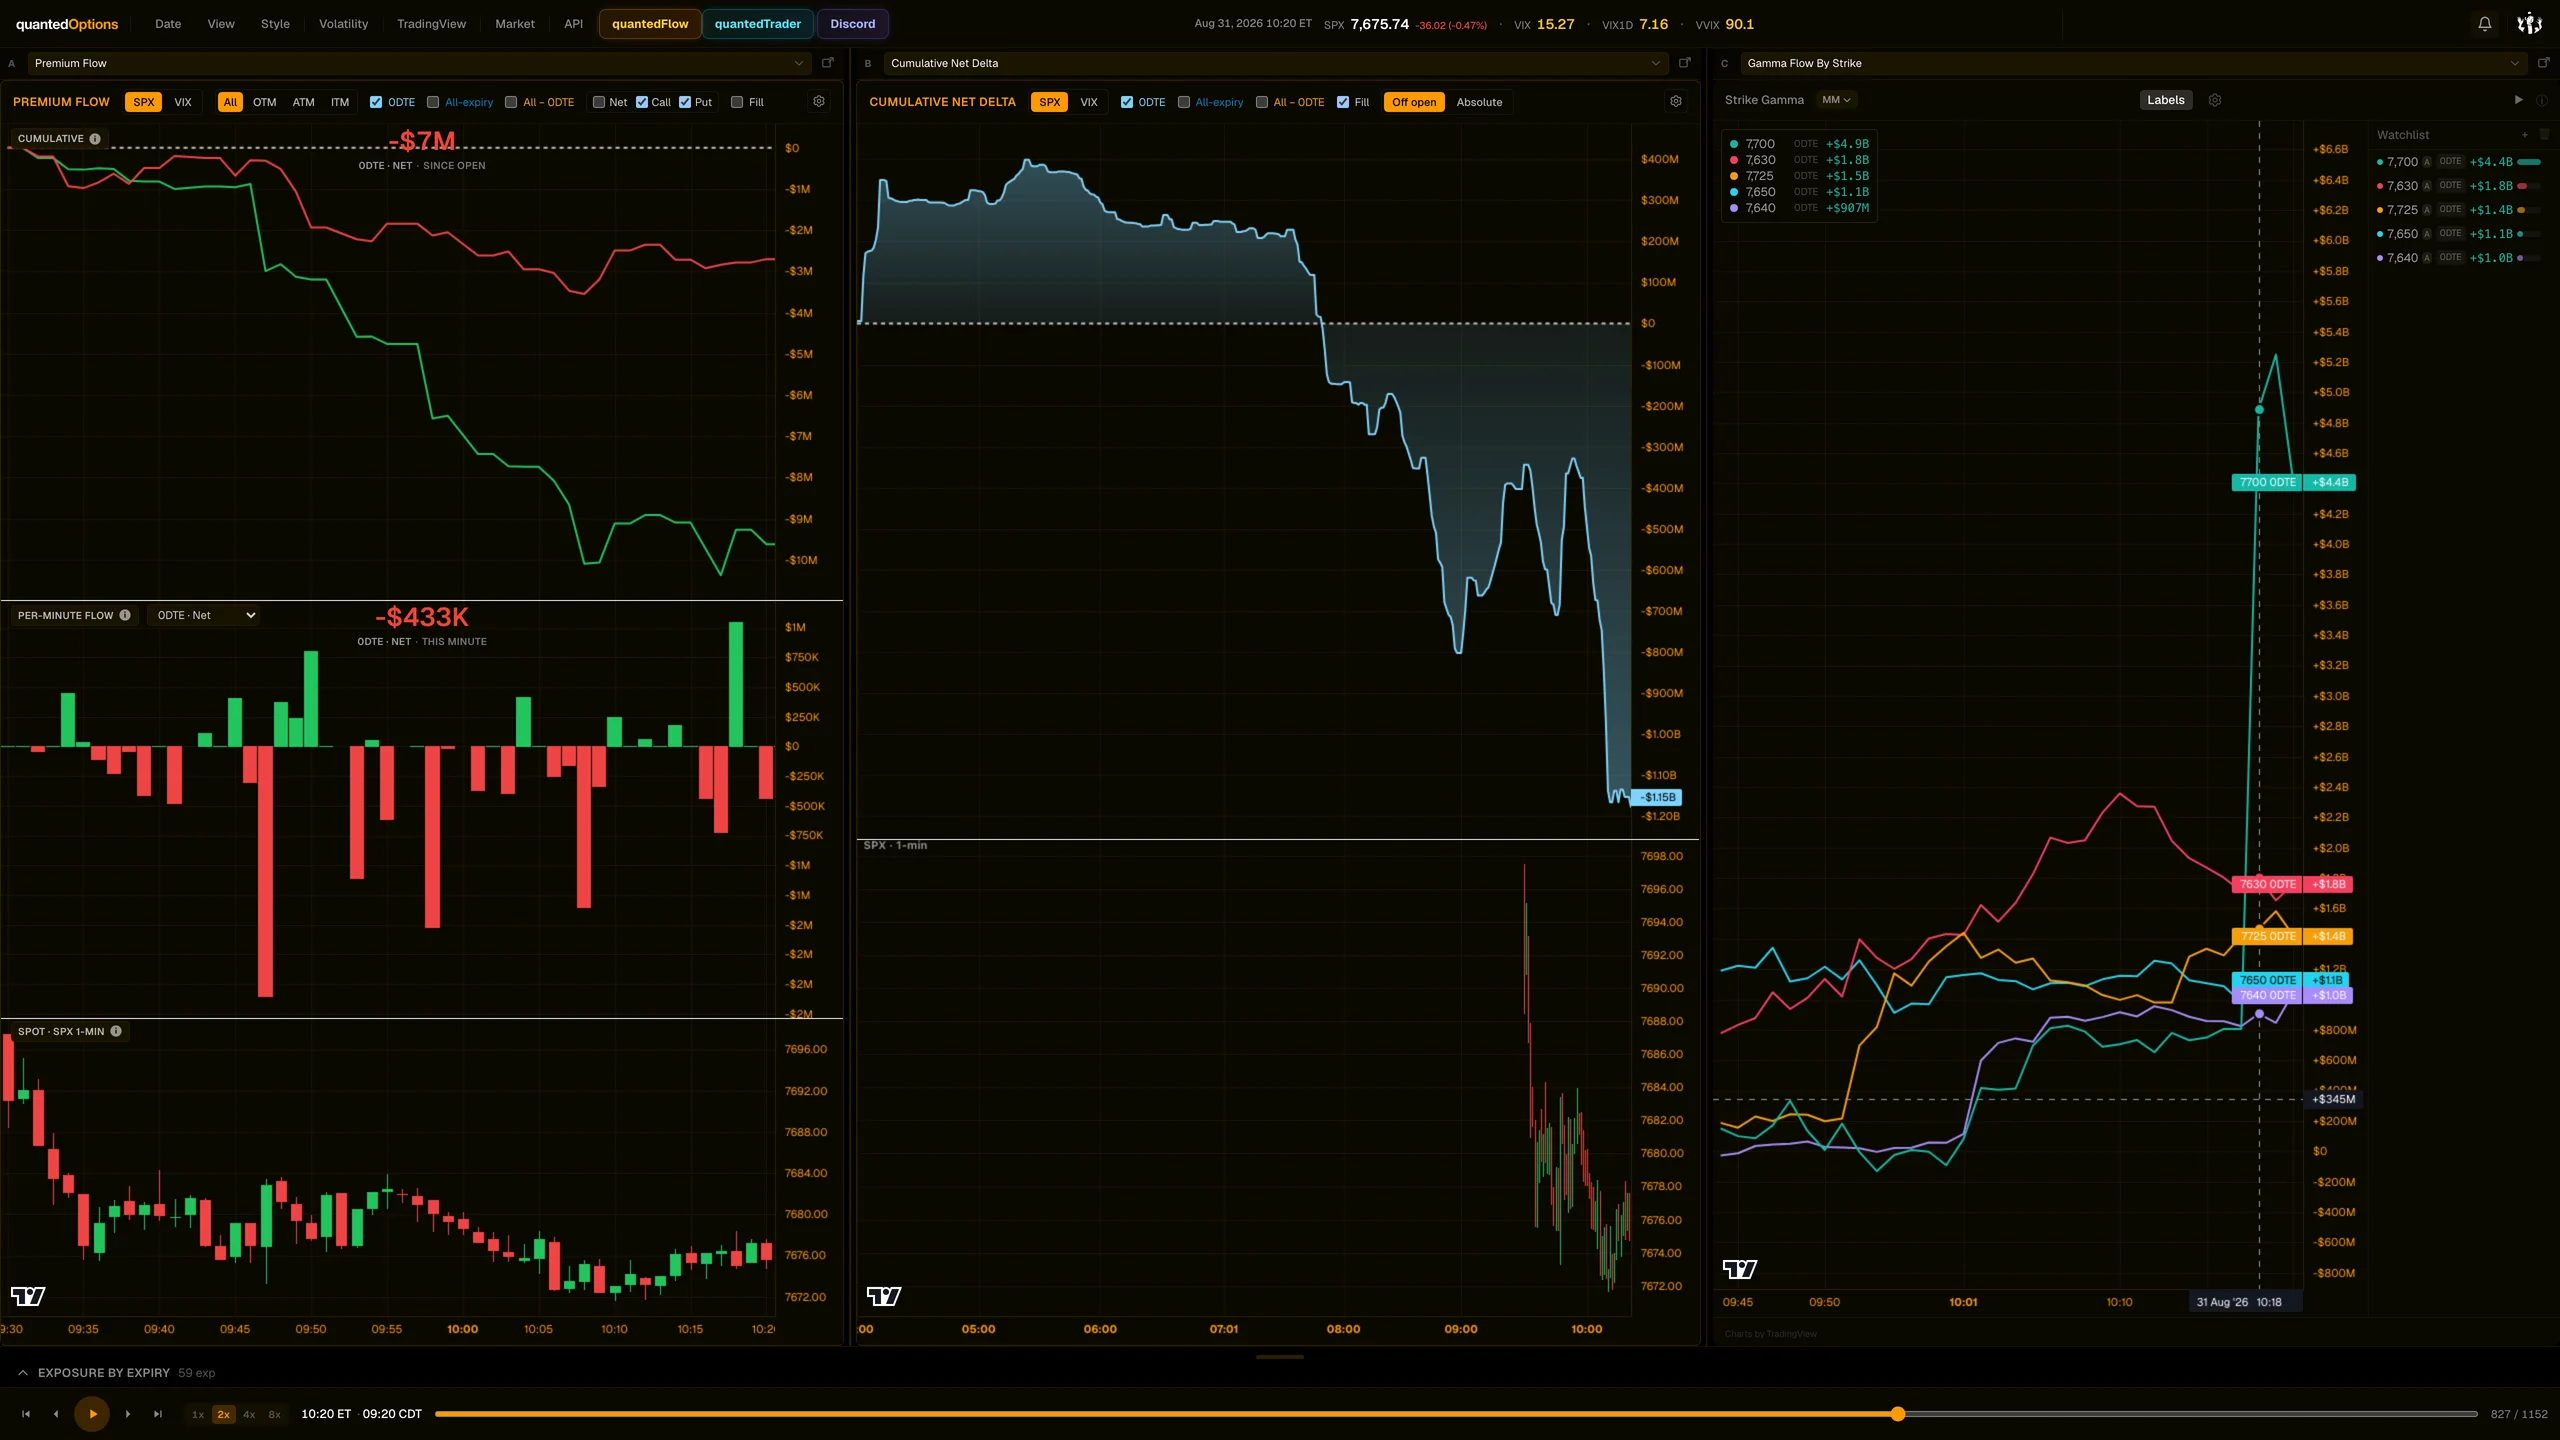
- 10:20 — 7700 jumped to +$4.4B against -$2.7B at 7705: a sold call spread directly overhead.
- The whole session fit inside 32.5 points, and the high, 7697.52, was the opening print. Every push up met 7700; every dip met the put strikes underneath.
- Then what: after 09:35 the best print of the day was 7696.33 in the final minute — still short of the strike named at 10:20.
Minute by minute
The beats
10:20 ETposted live
the post: huge spike in positive gamma at 7700, verticals sold
10:26 ET
session low 7665.06
13:12 ETposted live
the post: stuck in $6.9B of positive gamma
15:52 ET
afternoon push to 7692 — still under 7700
In #qo-market-data, as it happened
Posted live
Huge spike in positive gamma at 7700 with verticals sold
Stuck in $6.9b of positive gamma mud. That is a large value. Premarket commentary on $VIX 15 remains relevant through Wednesday.
From the product
The dashboard at each beat
Premium Flow, Cumulative Net Delta and Gamma Flow By Strike on one screen, replayed to the minute. Real frames, nothing redrawn. Click the right of the frame to step to the next beat.
Dashboard frame 1 / 4
10:20 ET — The post: huge spike in positive gamma at 7700, verticals sold
More of this session
The short cut
The short cut
9 slides
The case, slide by slide
Slide 1 / 9
These pages describe what the displays show and what the data did on the sessions shown. They are not trading advice, and a past session is not a forecast of a future one.