SPX Volatility page
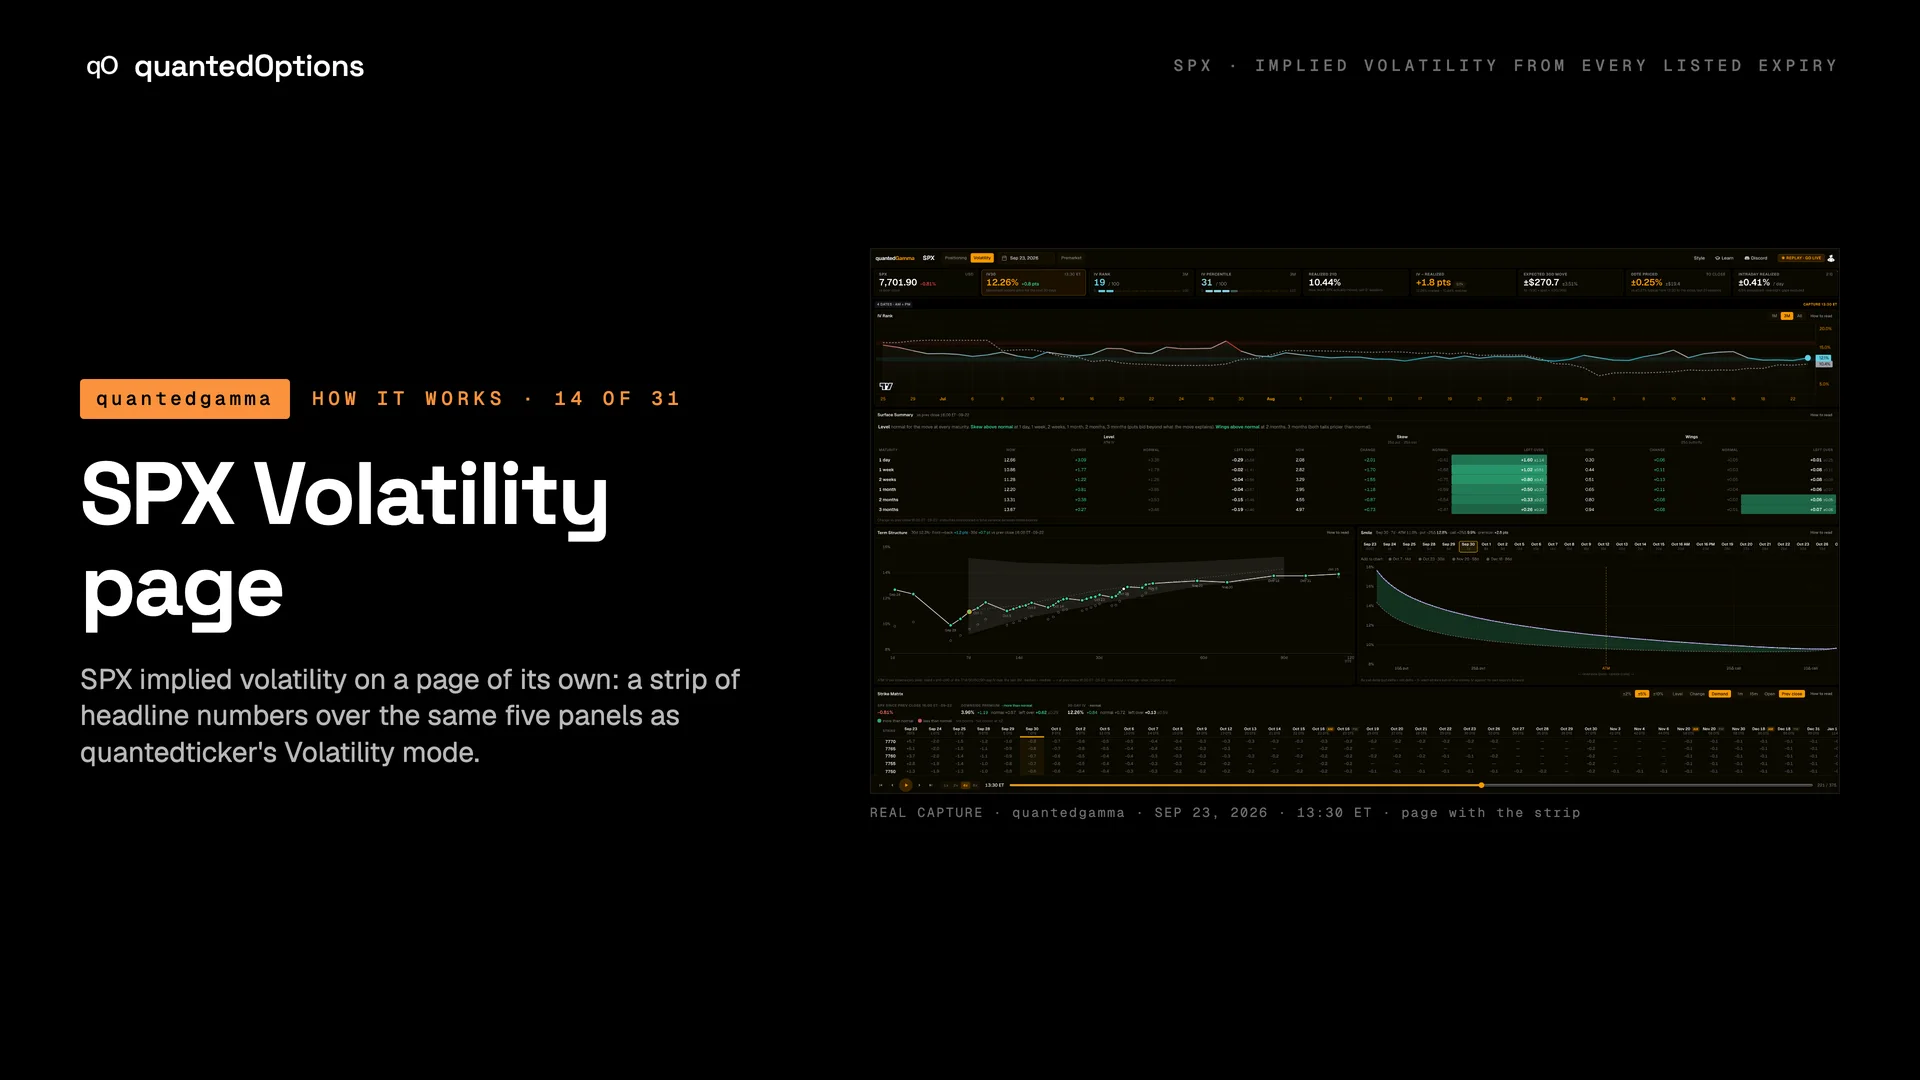
SPX implied volatility on a page of its own: a strip of headline numbers over the same five panels as quantedTicker's Volatility mode.
What it shows
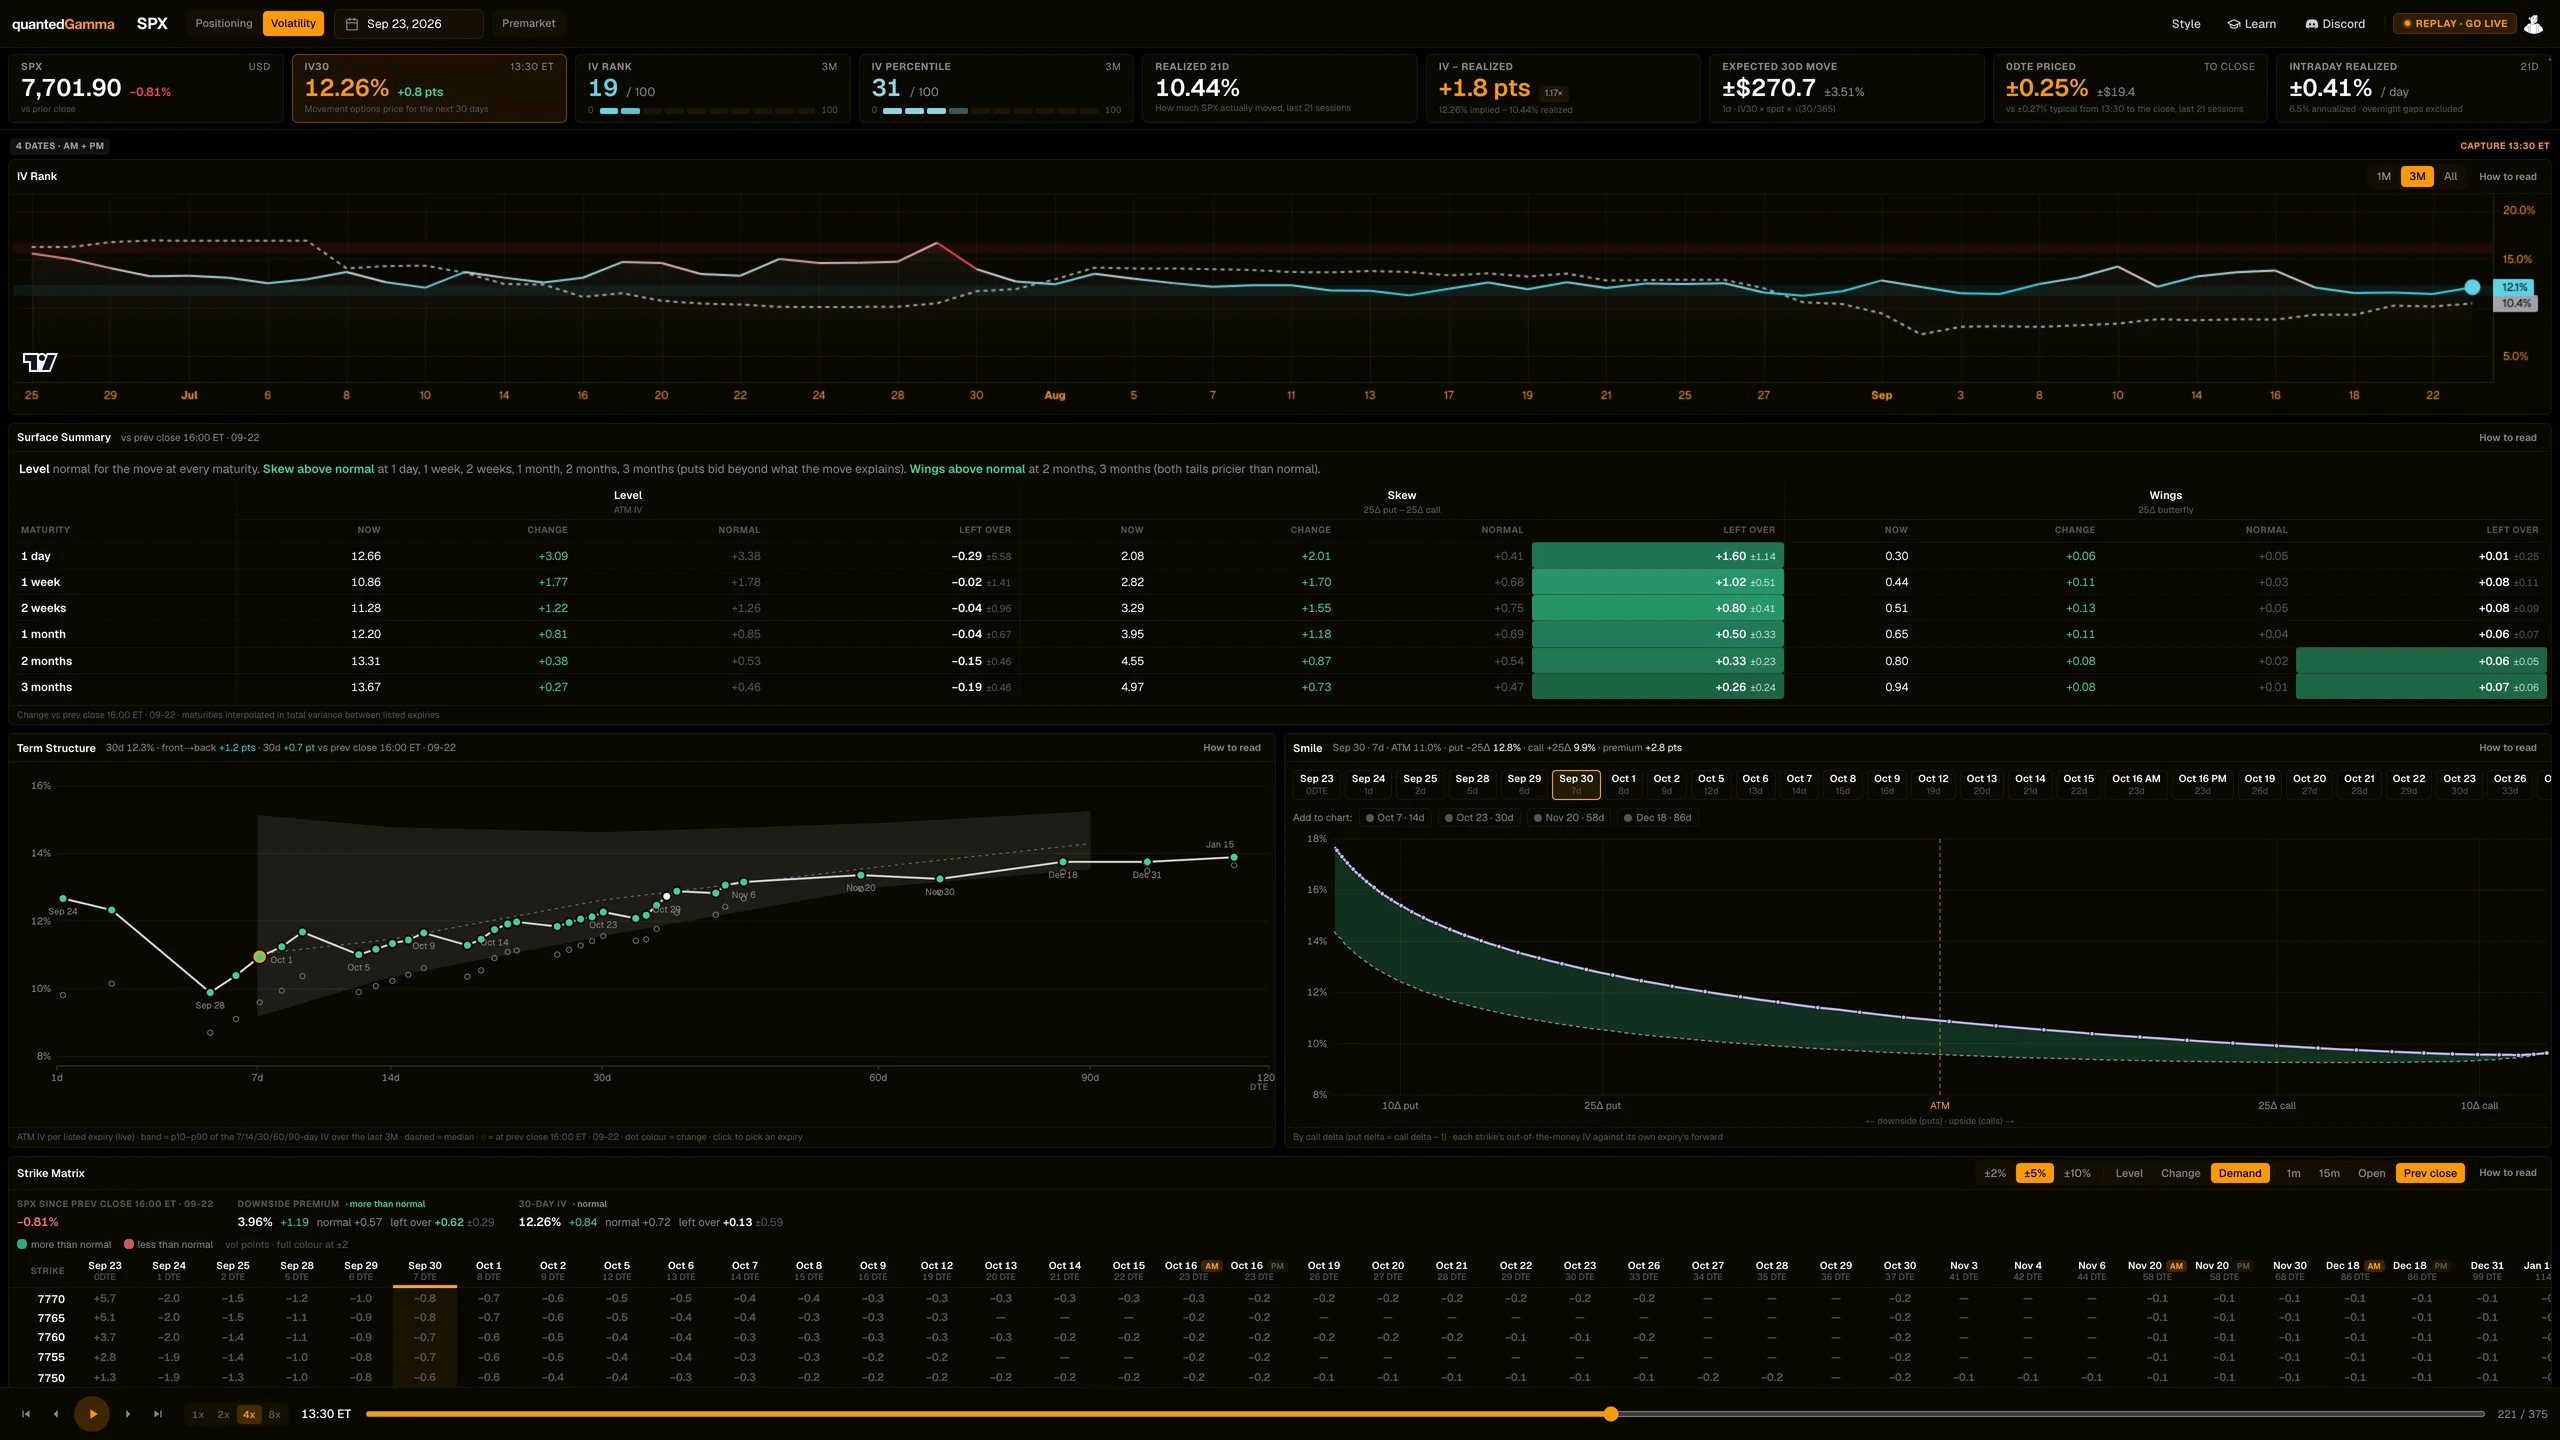
A header with the date picker, a Premarket toggle and the live / replay status; a strip of tiles (SPX and its move, IV30, IV Rank, IV Percentile, Realized 21d, IV - Realized, Expected 30d move, 0DTE priced, Intraday realized); then IV Rank, Surface Summary, Term Structure, Smile and Strike Matrix. A scrubber steps the page through the session minute by minute.
What it is built from
Every listed SPX and SPXW expiry, minute by minute. Implied volatility is worked out from each option's mid price against its own expiry's forward and settlement time, so a put and a call at the same strike agree. Realized volatility comes from SPX's own price.
Reading
How to read it
- IV30 is the 30-day at-the-money IV at the minute on screen, with its change since the previous close.
- IV Rank and IV Percentile place IV30 in the history window picked on the IV Rank panel (1M, 3M or All).
- Realized 21d is how much SPX actually moved over the last 21 sessions, close to close, on the same annualized scale as IV. IV - Realized is the gap in vol points.
- 0DTE priced is the one-standard-deviation move today's 0DTE at-the-money options price from the minute on screen to the 16:00 close, in percent and dollars; its caption gives how much SPX typically moves over the same part of the day.
- Intraday realized is SPX's typical move inside the session (09:35 to 16:00), with overnight gaps left out.
- The panels below the strip read as in quantedTicker's Volatility mode. For SPX, the Surface Summary's normal change is measured on SPX's own sessions.
- A date that lists two contracts shows both, tagged AM (the monthly, settled at the 09:30 open) and PM (the weekly, settled at 16:00); the term structure uses the AM monthly.
Controls
What each control does
| Control | Options | What it changes |
|---|---|---|
| Date picker | any stored session | Which session is shown. |
| Premarket | on / off | Before 09:30 ET, shows the prior session's closing surface, tagged 'Frozen'. |
| Replay scrubber | any capture minute | Steps the page through the session; the status reads 'replay - go live' until you return to the latest frame. |
| Strip | hide / show | Hides or shows the headline tiles. |
| Positioning | Volatility | Positioning, Volatility | Positioning returns to the quantedGamma dashboard. |
| Style | dashboard themes | The same themes as the quantedGamma dashboard. |
| Panel controls | History window, picked expiry, Add to chart, Matrix range, Level / Change / Demand, Compare to | As in quantedTicker's Volatility mode. |
Read it with
- Volatility mode (IV Rank, Surface Summary, Term Structure, Smile, Strike Matrix) — the same five panels for any quantedTicker ticker
- Volatility, TradingView, Market, API and product buttons — the Volatility button opens this page
- Header readouts — VIX, VIX1D and VVIX beside SPX's own implied volatility
Good to know
- The page opens in its own tab, so the dashboard you came from keeps its date, minute and layout.
- Before 09:30 ET SPX's value is still the previous close, which is why Premarket shows the closing surface.
- The 0DTE tiles read 'settled' after 16:00 and a dash on a day with no same-day expiry.
A real session
See it happen
13:30 ET
SPX 2026-09-23 at 13:30, down 0.81% on the 09-22 close: the Surface Summary reads Level normal for the move at every maturity, Skew above normal at every maturity and Wings above normal at 2 and 3 months; the downside premium rose 1.19 points against a normal 0.57.
13 slides
The walk-through, slide by slide
Slide 1 / 13
From the product
Real frames
Shot off the live product, nothing redrawn. Click the right side of a frame for the next one, the left side to go back.
Product frame 1 / 5
These pages describe what the displays show and what the data did on the sessions shown. They are not trading advice, and a past session is not a forecast of a future one.