Volatility mode (IV Rank, Term Structure, Skew, Fixed-Strike IV, IV Surface)
The ticker's implied volatility: where it ranks, by expiry, by strike.
What it shows
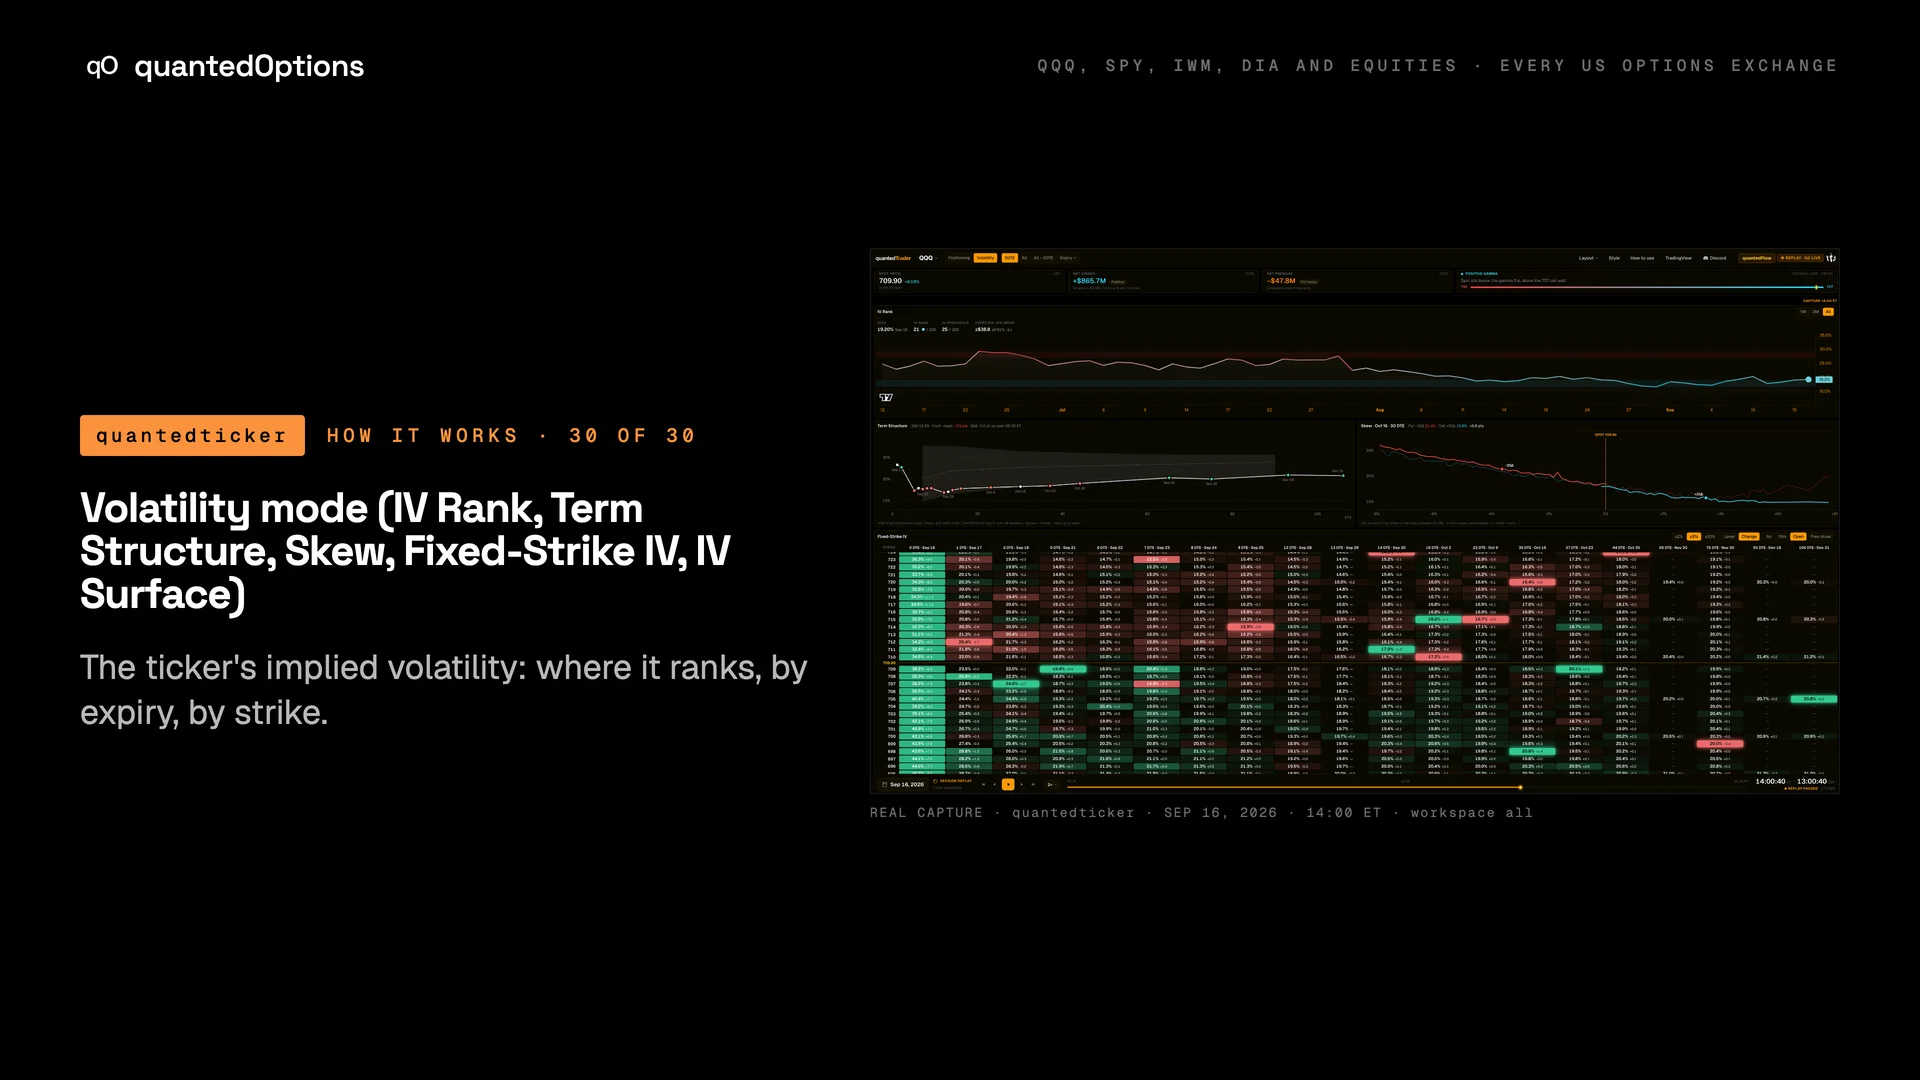
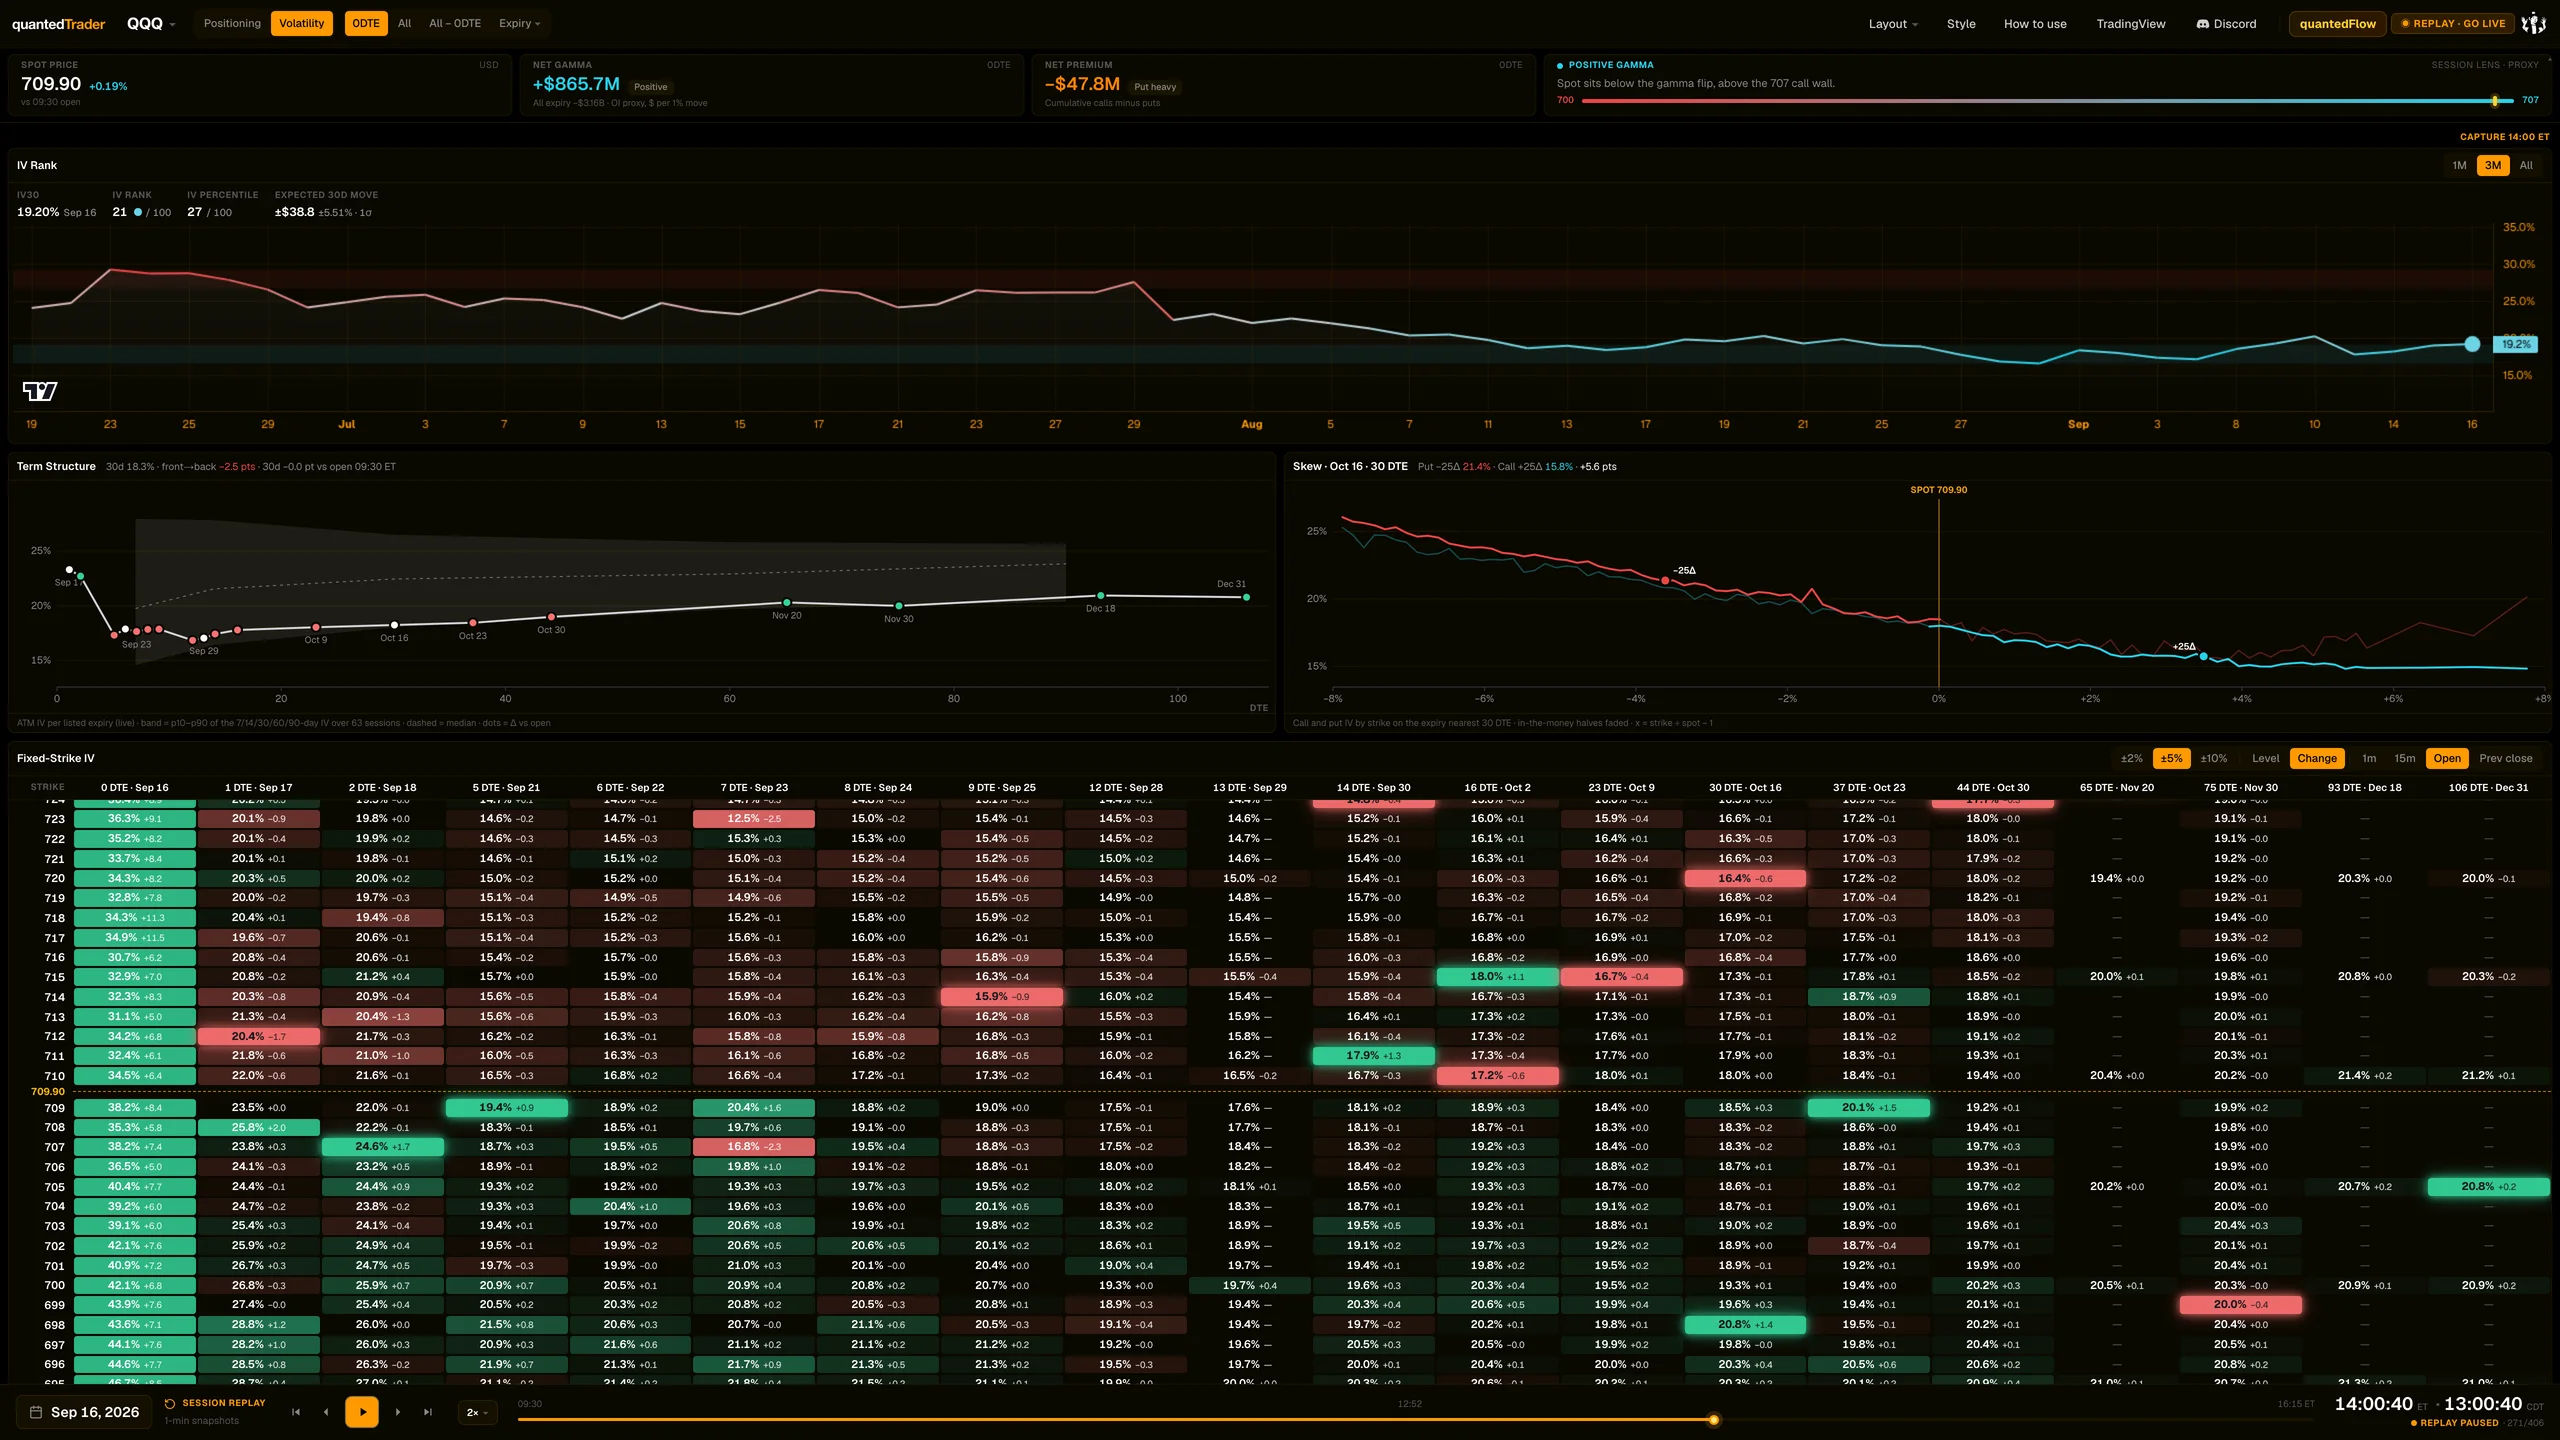
Five panels that follow the date and the replay minute: IV Rank with a 30-day expected move, Term Structure of at-the-money IV, Skew for the expiry nearest 30 days, a Fixed-Strike IV matrix and an IV Surface.
What it is built from
Implied volatility for the ticker's options, from data consolidated across every US options exchange, with its own history for rank and percentile.
Reading
How to read it
- IV Rank near 100 means IV is at the top of its window; near 0, the bottom.
- A term-structure point above its shaded band is unusually high for that tenor.
- Positive skew means puts are priced richer than calls.
Controls
What each control does
| Control | Options | What it changes |
|---|---|---|
| History window | 1M, 3M, All | Window for rank, percentile and the band. |
| Matrix range | +/-2%, +/-5%, +/-10% | Strikes shown. |
| Matrix tint | Level, Change | Colour by IV level or by change. |
| Change baseline | 1m, 15m, Open, Prev close | What 'Change' compares to. |
| Surface zoom | Fit, 2x, 4x, 8x | Surface zoom. |
Good to know
- All five panels follow the date and the minute on the replay bar.
- The term structure begins with the first expiry after today.
A real session
See it happen
15:30 ET
QQQ 2026-09-16 at 15:30, after the Fed decision: IV30 19.20%, IV Rank 21 / 100, IV Percentile 27 / 100, expected 30-day move +/-$38.8. Skew on the Oct 16 expiry reads +6.5 pts: puts priced richer than calls.
10 slides
The walk-through, slide by slide
Slide 1 / 10
From the product
Real frames
Shot off the live product, nothing redrawn. Click the right side of a frame for the next one, the left side to go back.
Product frame 1 / 8
These pages describe what the displays show and what the data did on the sessions shown. They are not trading advice, and a past session is not a forecast of a future one.