EXPOSURE BY EXPIRY drawer
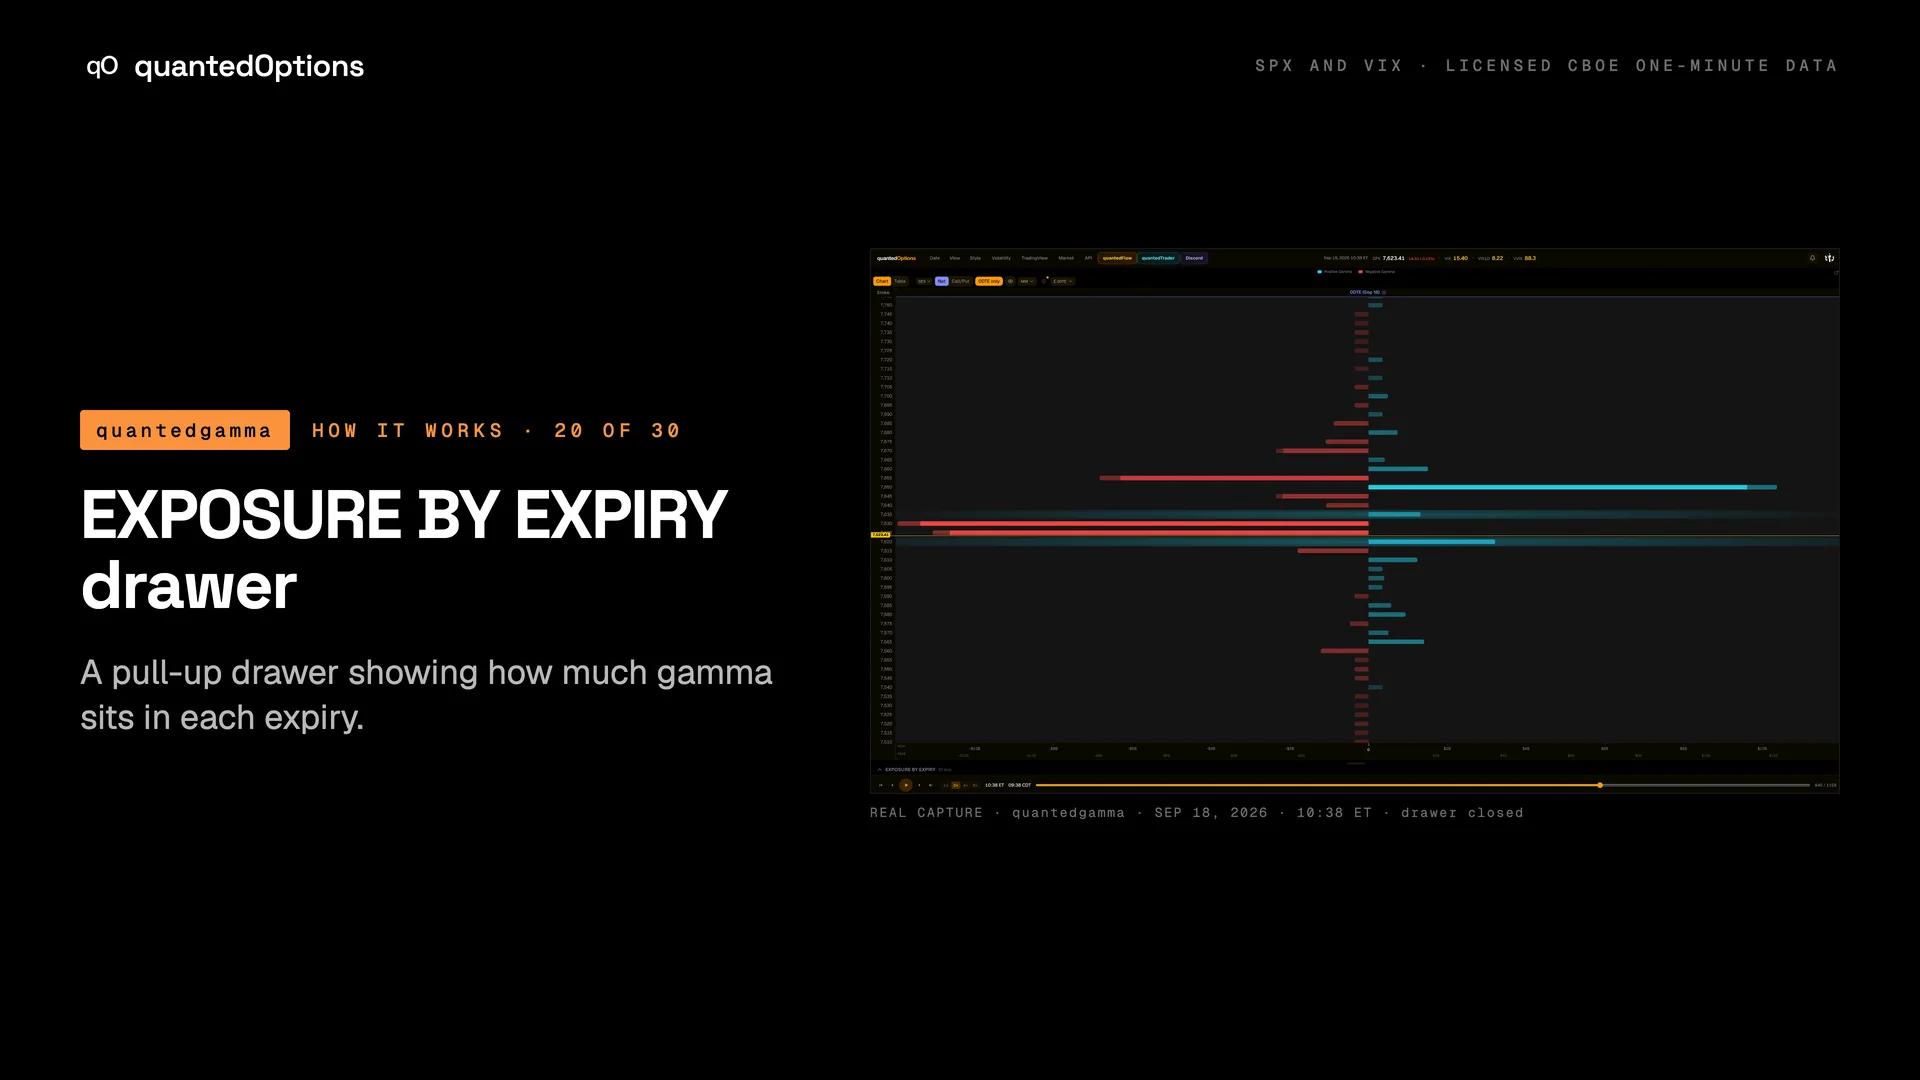
A pull-up drawer showing how much gamma sits in each expiry.
What it shows
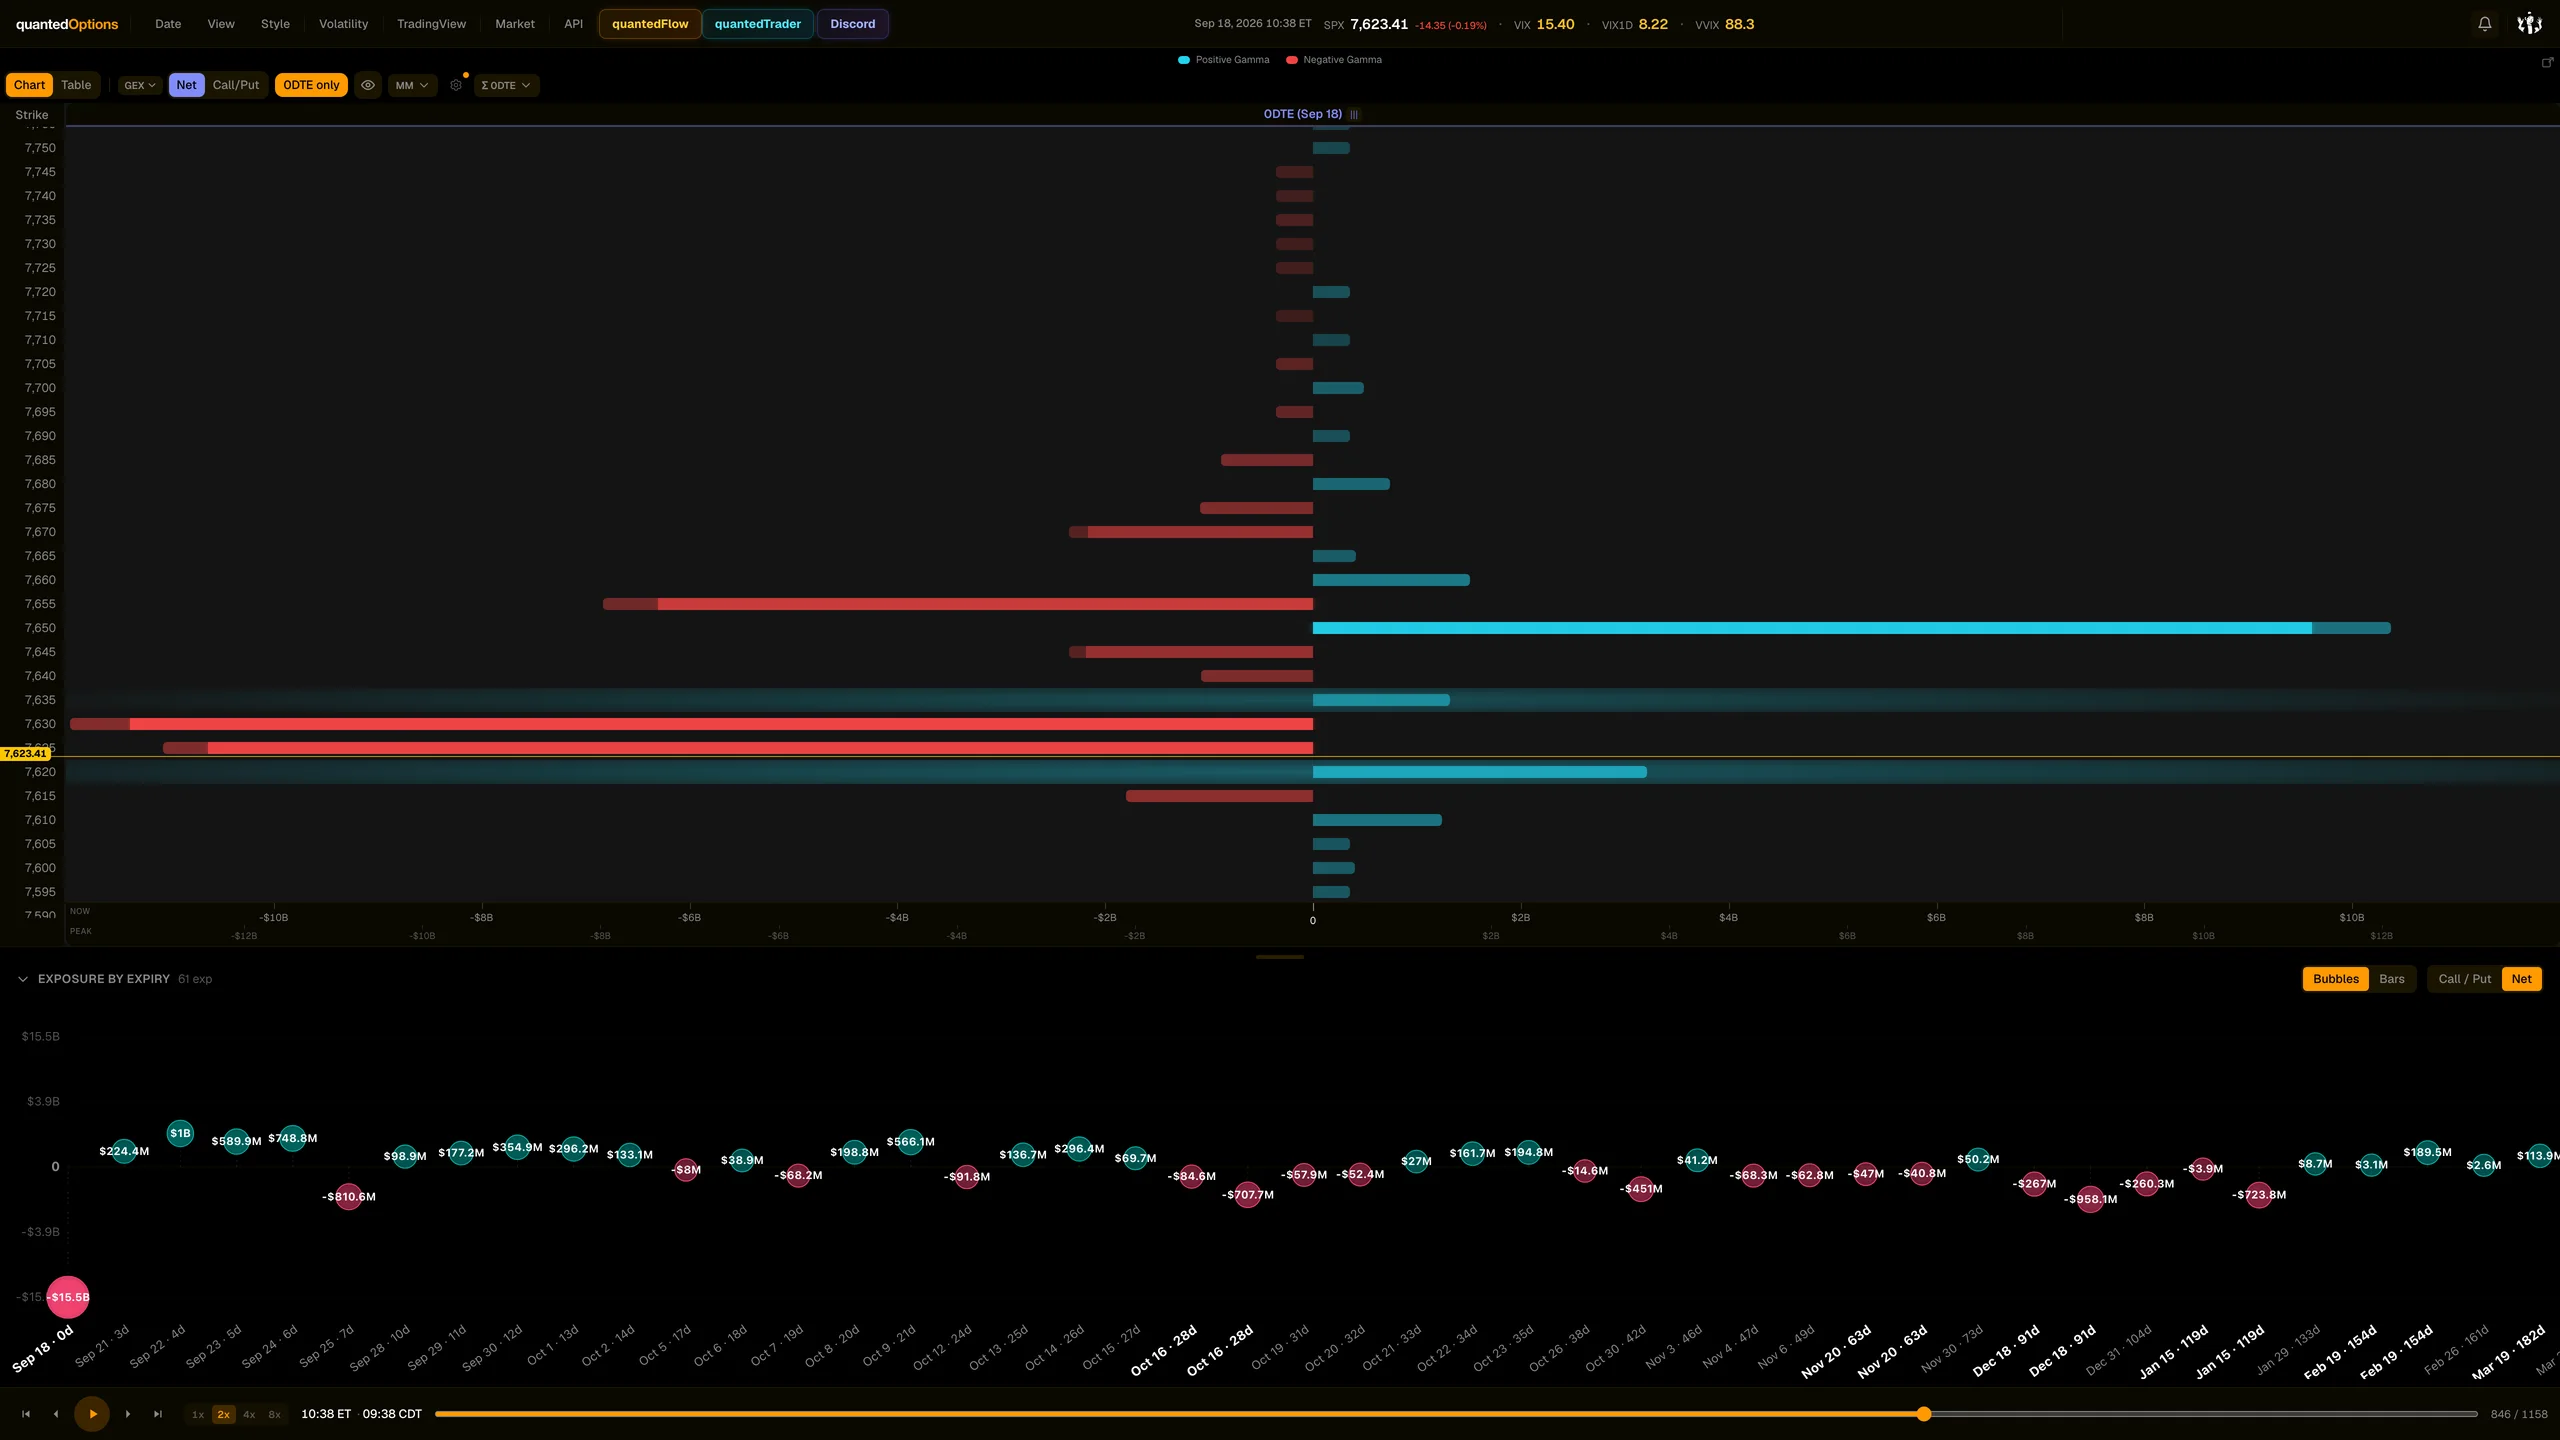
A collapsed strip above the replay bar titled 'EXPOSURE BY EXPIRY' with a count of expiries. Opened, it draws one bubble or bar per expiry with its DTE, net GEX, calls, puts and percent calls at the replay minute.
What it is built from
Market-maker gamma, totalled for each expiry at the minute on screen. Built from licensed CBOE one-minute SPX and VIX data with market-maker positioning, recomputed every minute.
Reading
How to read it
- A big 0DTE bubble beside small later ones means today's book dominates the hedging.
- A big third-Friday bubble is the monthly expiry's weight.
- In Call / Put mode each expiry splits into its call and put exposure; in Net mode the sign is the colour.
Controls
What each control does
| Control | Options | What it changes |
|---|---|---|
| Open / close | click the strip | Expands the drawer (default closed). |
| Bubbles | Bars | default Bubbles | Chart type. |
| Call / Put | Net | default Net | Split or net view. |
Read it with
- SPX Strike Profile - Table — the table's columns are these expiries
- SPX Surface - Gamma (0DTE | All) — how much 'All' adds over 0DTE
Good to know
- It follows the page product (SPX or VIX) and the minute on screen.
- 0DTE, 1DTE and third-Friday expiries are flagged as key expiries.
A real session
See it happen
10:38 ET
Monthly expiry day, 2026-09-18: the expiring contract's bubble against the rest of the term.
11 slides
The walk-through, slide by slide
Slide 1 / 11
From the product
Real frames
Shot off the live product, nothing redrawn. Click the right side of a frame for the next one, the left side to go back.
Product frame 1 / 4
These pages describe what the displays show and what the data did on the sessions shown. They are not trading advice, and a past session is not a forecast of a future one.