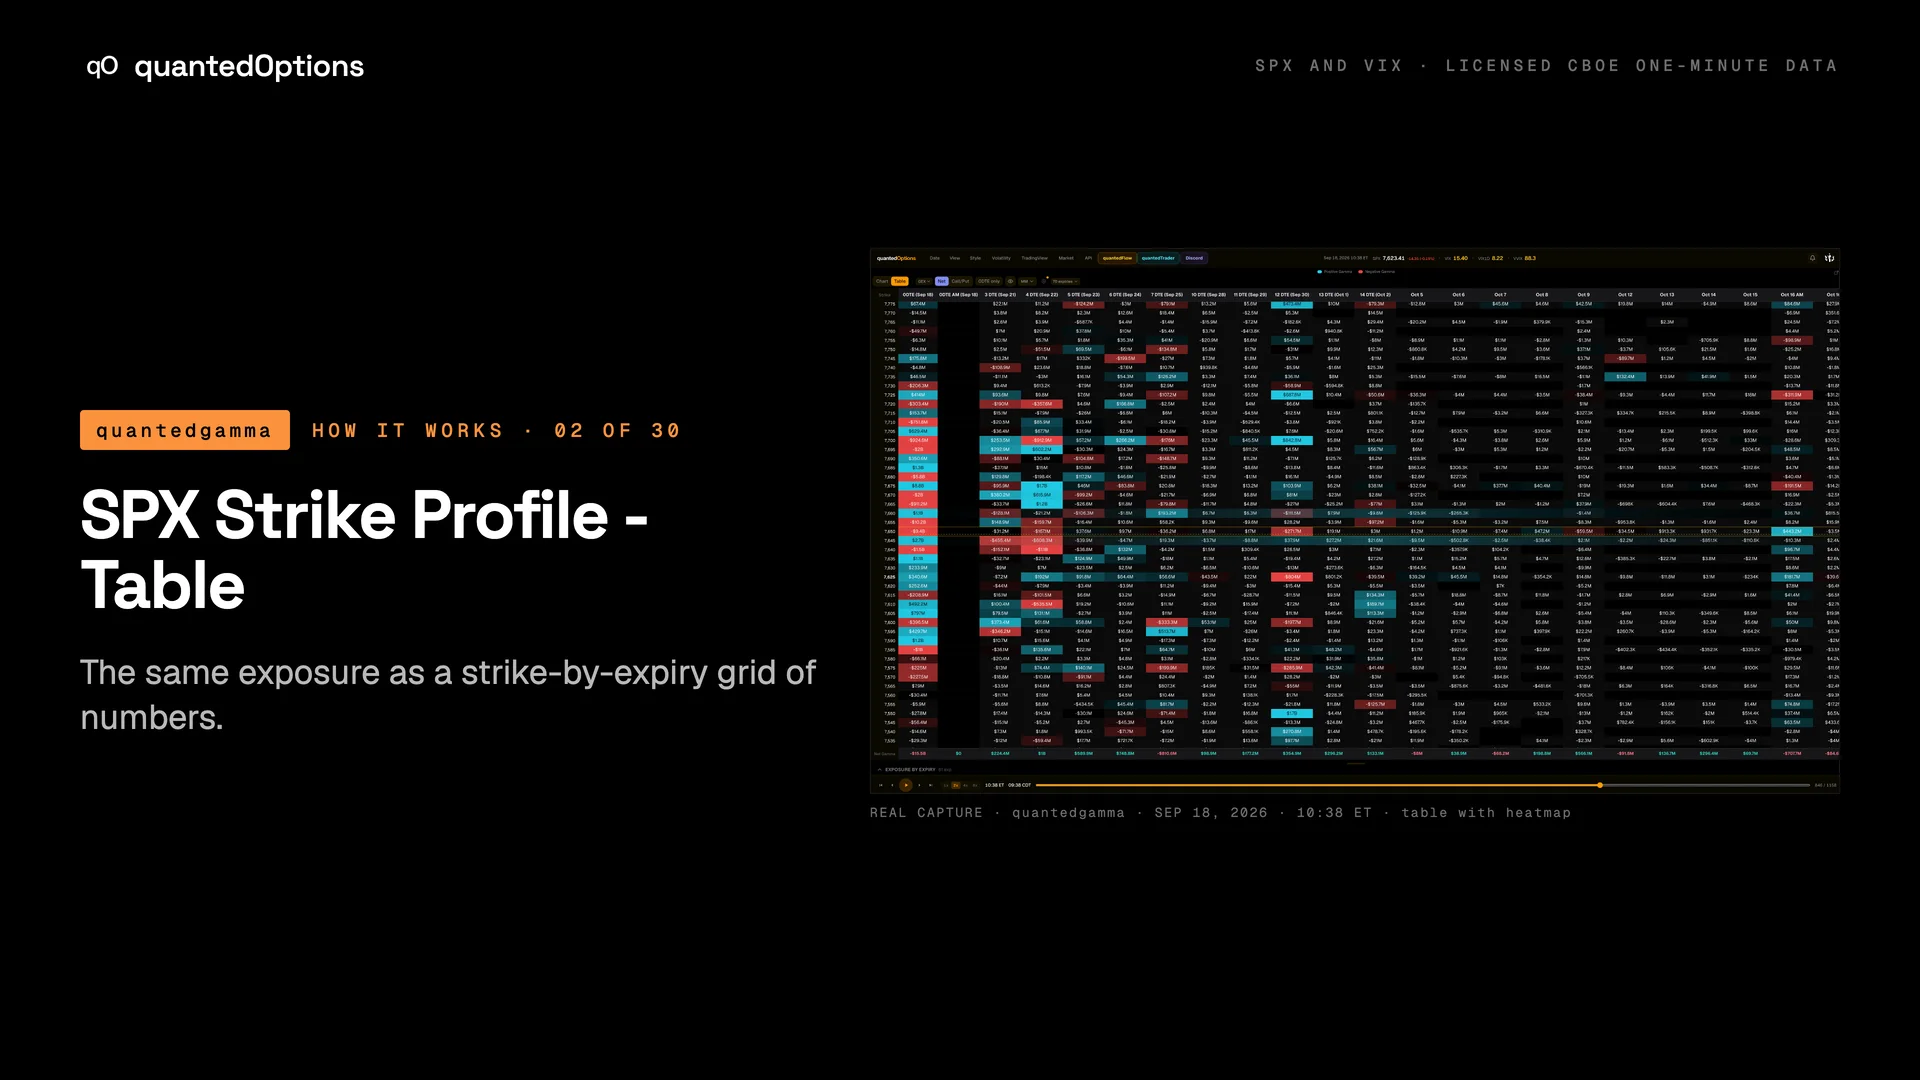
SPX Strike Profile - Table
The same exposure as a strike-by-expiry grid of numbers.
What it shows
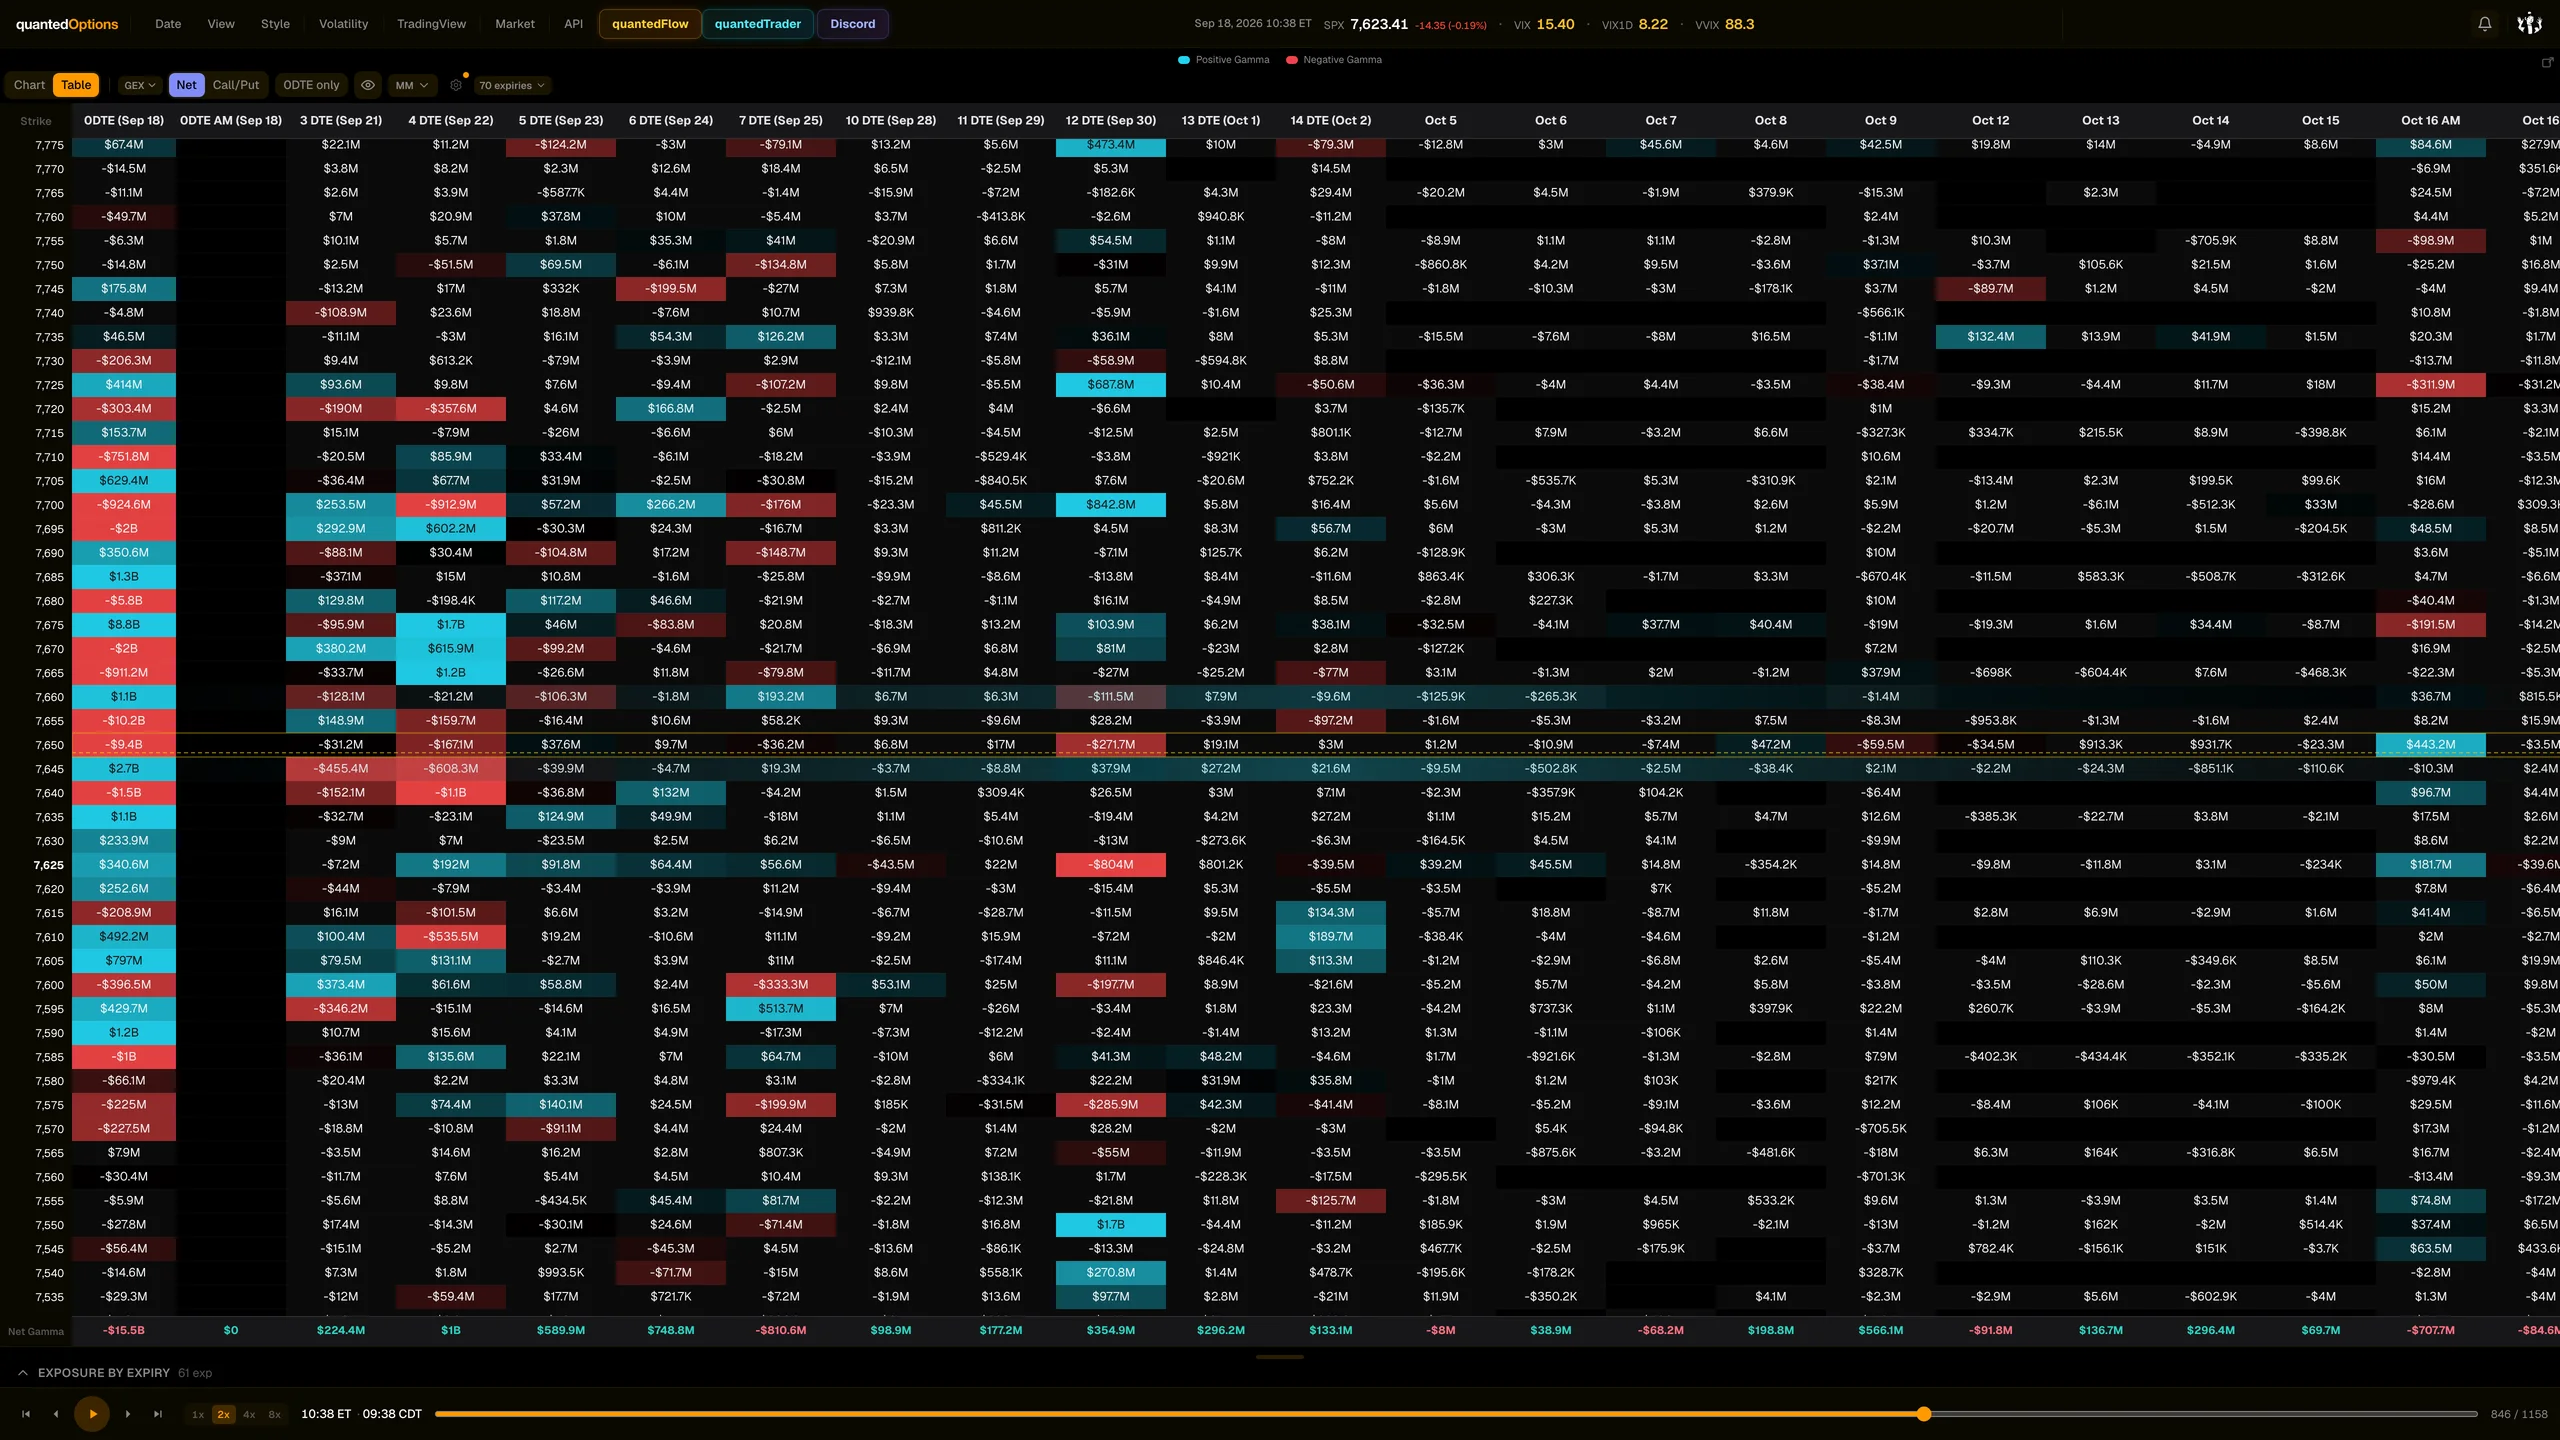
Rows are strikes, columns are expiries, and each cell is the market-maker exposure for that strike and expiry at the replay minute. It is the Table view of the Strike Profile slot and shares its metric, range and account-type settings.
What it is built from
The same market-maker exposure as the Strike Profile chart, laid out by strike and by expiry. Built from licensed CBOE one-minute SPX and VIX data with market-maker positioning, recomputed every minute.
Reading
How to read it
- Read across a row to see which expiry carries a strike's exposure.
- Read down a column to see one expiry's ladder as numbers.
- A column headed with 'AM' is an AM-settled expiry (SPX third-Friday monthly).
- With Heatmap on, the largest cells take colour and the rest fade to the background.
Controls
What each control does
| Control | Options | What it changes |
|---|---|---|
| Data mode dropdown | GEX, DEX, VEX, CEX | Which exposure fills the cells. |
| Settings > Scale | $ (absolute), %, +/-10 | Dollar values, or each cell as a share of its column's largest cell, shown as a percent or on a -10 to +10 scale. |
| Settings > Heatmap | On / Off (default off) | Shades the largest cells on screen so the strikes that matter stand out. |
| Expiry column picker | All, Clear, Wk, 2W, OPEX, Mth, or tick individual expiries | Which expiry columns are visible. Saved per slot. |
| 0DTE only | on / off | Collapses the table to the front column. |
| Range / Step / Account type | same as the chart view | Same effect as in the chart view. |
Read it with
- SPX Strike Profile — same slot, other view
- EXPOSURE BY EXPIRY drawer — the drawer totals each column
Good to know
- % and +/-10 compare cells within one column. Use $ to compare across expiries.
- It shares its metric, range and account type with the chart view, so you can flip between the two on the same minute.
A real session
See it happen
10:38 ET
Monthly expiry day: the 0DTE column beside the later expiries; 7650 at +$8.8B one minute before it left the board.
10 slides
The walk-through, slide by slide
Slide 1 / 10
From the product
Real frames
Shot off the live product, nothing redrawn. Click the right side of a frame for the next one, the left side to go back.
Product frame 1 / 3
These pages describe what the displays show and what the data did on the sessions shown. They are not trading advice, and a past session is not a forecast of a future one.