Sierra Chart
A native study whose levels your own Sierra alerts and spreadsheets can read.

What it shows
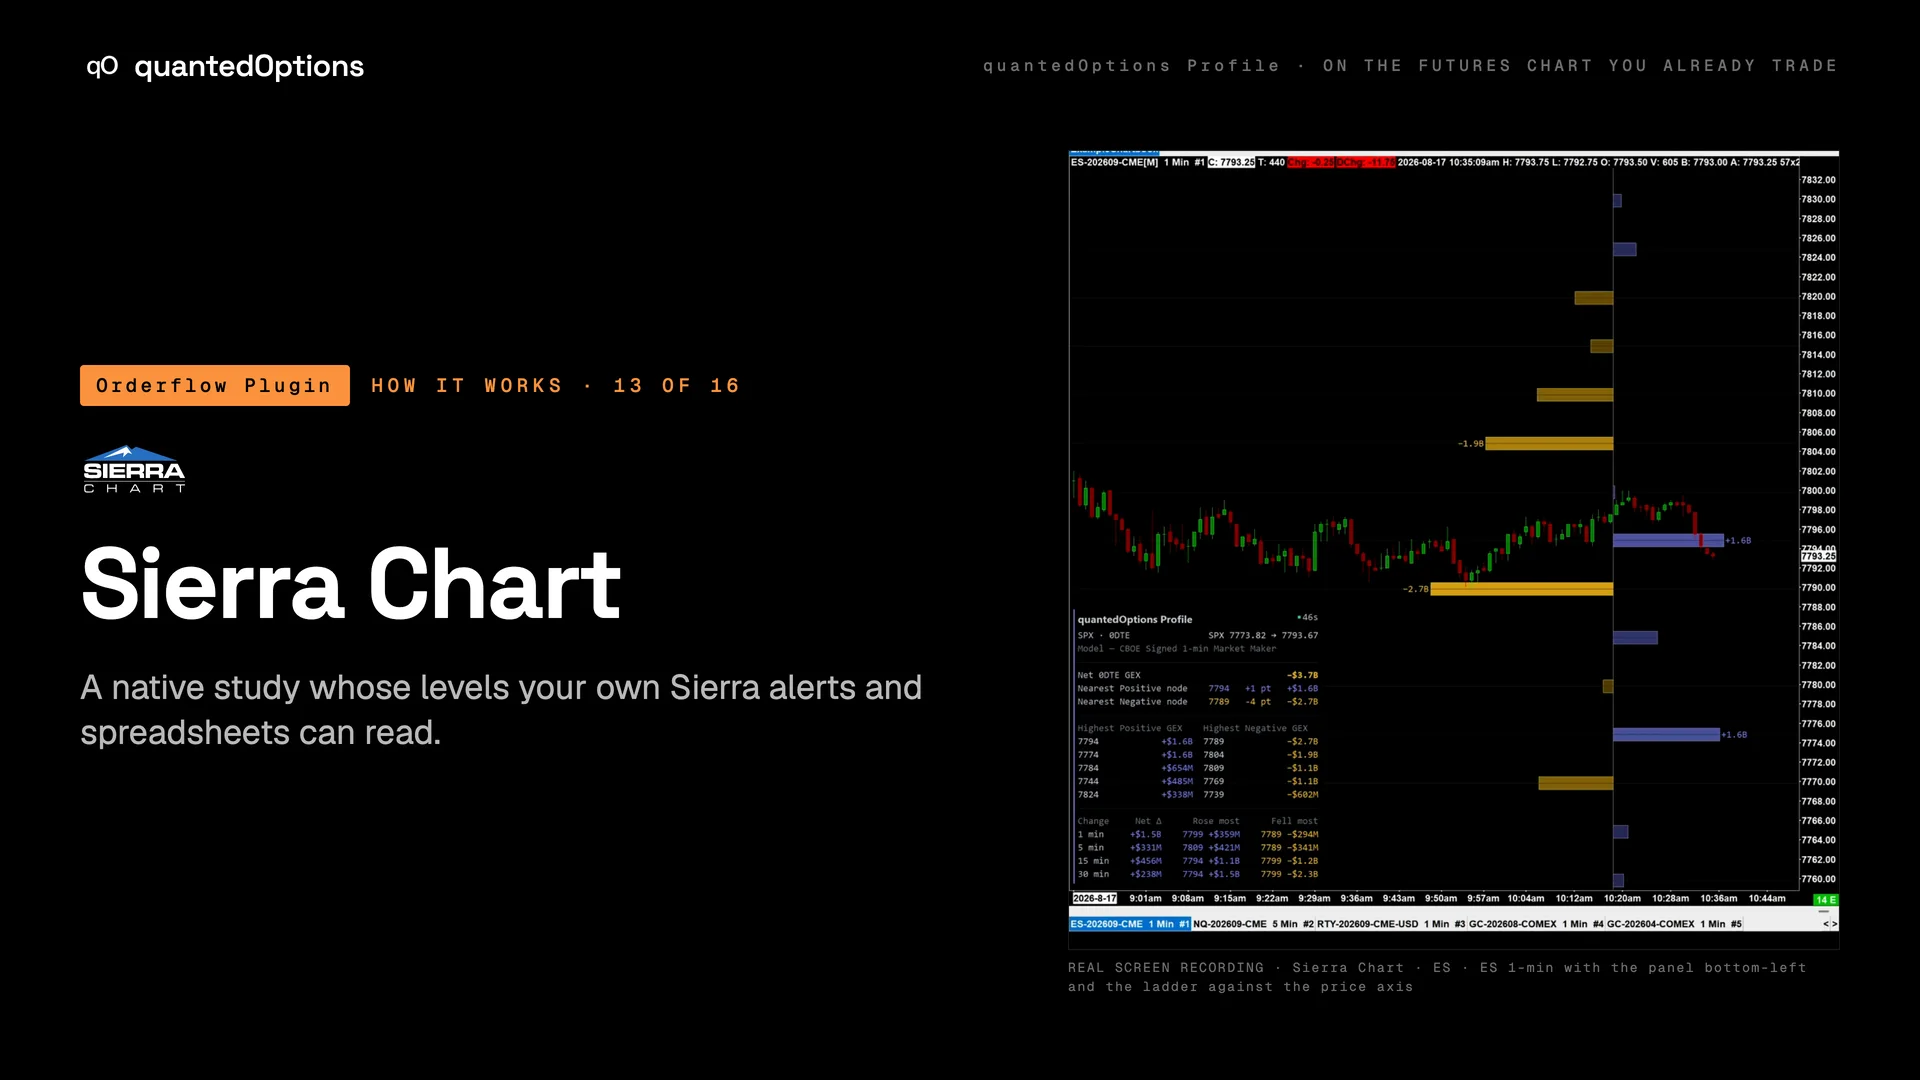
A native Sierra Chart study: the ±1 straddle band labelled, gamma nodes at the strikes and the panel bottom-left, drawn steadily with no flicker. The levels can be written out to study subgraphs, so Sierra's alerts, spreadsheets and studies read the market-maker book directly. An ARM64 build is available for Windows on ARM, which is what Parallels runs on an M-series Mac.
What it is built from
The same data, the same settings and the same key as every other platform. On ES and MES: licensed CBOE one-minute data with market-maker positioning, from SPX. On the other families: computed from data consolidated across every US options exchange: open interest and volume.
On this platform
Only on Sierra Chart
Subgraph export, so native Sierra alerts, spreadsheets and studies can use the levels; plus an ARM64 build.
- Runs on
- Sierra Chart 64-bit, build 2910 or newer; ARM64 build for Windows on ARM
- OS
- Windows
Three steps
- 01Download the Sierra Chart add-on from your Orderflow Plugin page and unzip it.
- 02Copy the one .dll into your Data Files Folder and start Sierra Chart.
- 03Open Analysis › Studies › Add Custom Study, add quantedOptions Profile, paste your key in the connection settings and leave Source and Conversion on AUTO.
Reading
How to read it
- With subgraph export on, the levels are study subgraphs: build native Sierra alerts on the gamma levels.
- Overnight the time axis carries the date change while the nodes stay drawn across it.
- Until the first data arrives the chart shows a small label: 'quantedOptions Profile - connecting'.
- ES and NQ side by side each resolve their own book.
Settings
What each setting does
| Setting | Options | What it changes |
|---|---|---|
| Write levels to subgraphs | on / off (default off) | Writes the levels to study subgraphs for Sierra alerts. Keep the study scale on Independent. |
| Lane headers: distance from the top (px) | px (Sierra default 22) | Moves the lane titles down so chart text stays clear of them. |
Read it with
- Gamma nodes at the strikes — one bar per strike: positive nodes slow price, negative nodes let it through
- Day and night: the overnight session and the roll — live overnight; after the cash close it rolls to the next expiry
- The data panel — the regime, the nearest nodes, the top strikes and what changed, in one corner
Good to know
- Add it from Analysis › Studies › Add Custom Study: expand quantedOptions Profile and select the study of the same name.
- On an M-series Mac under Parallels, take the ARM64 build; Windows PCs and Intel Macs take the standard download.
On a real chart
See it happen
Sierra Chart · ES and NQ, the night of 2026-08-18 into 08-19: the ES time axis runs from 7:05pm across the date change to 8:55am with the nodes drawn the whole way. The axis is the evidence.
11 slides
The walk-through, slide by slide
Slide 1 / 11
These pages describe what the displays show and what the data did on the sessions shown. They are not trading advice, and a past session is not a forecast of a future one.