ATAS X
The market-maker book beside your footprint and cluster charts.

What it shows
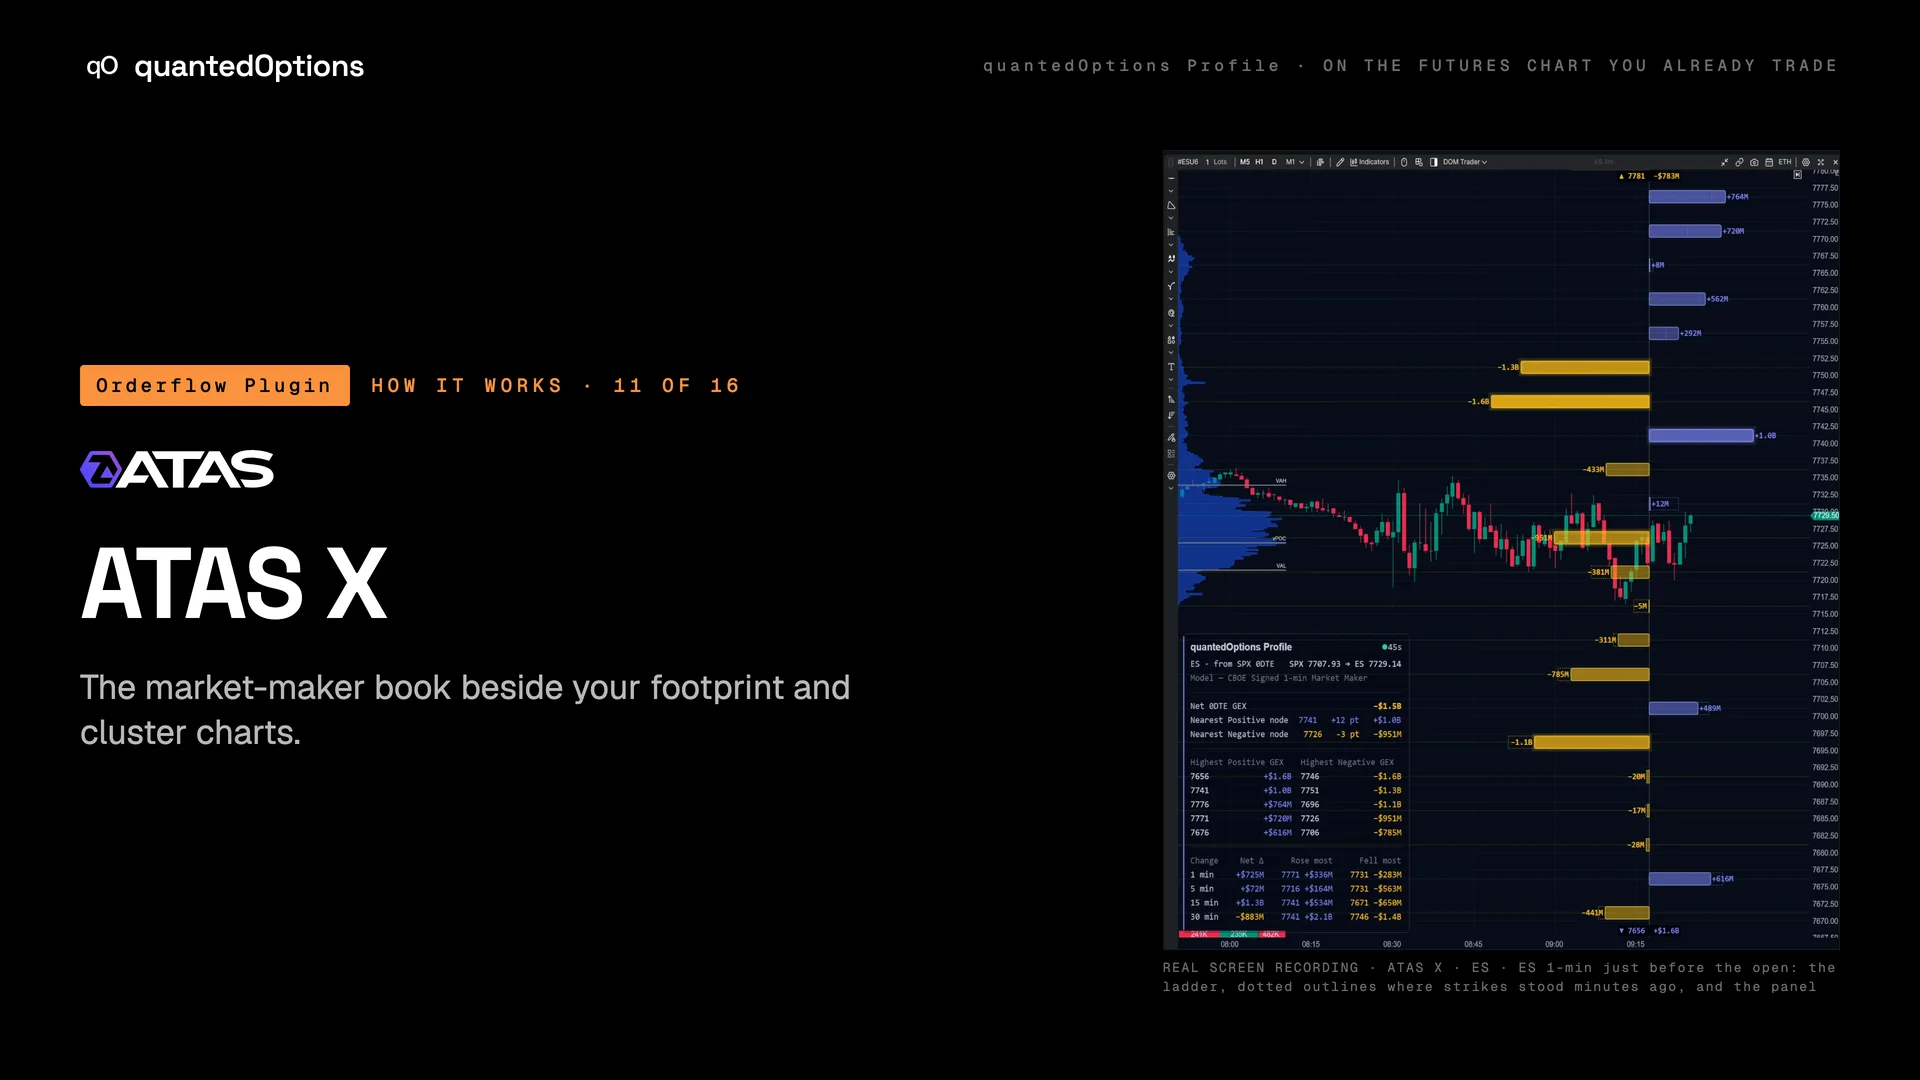
Order-flow traders who already read footprint and cluster charts get the market-maker book on the same screen, in the same visual language. The Profile sits alongside ATAS's footprint, cluster and delta tooling on the same chart: labelled levels, the strike-by-strike exposure ladder on the right axis, the straddle band and the full panel.
What it is built from
The same data, the same settings and the same key as every other platform. On ES and MES: licensed CBOE one-minute data with market-maker positioning, from SPX. On the other families: computed from data consolidated across every US options exchange: open interest and volume.
On this platform
Only on ATAS X
Sits beside ATAS's footprint, cluster and delta tooling on the same chart.
- Runs on
- ATAS X with an Ultra licence
- OS
- Windows · macOS
Three steps
- 01Download the ATAS add-on from your Orderflow Plugin page and unzip it.
- 02Copy the one .dll into the ATAS X Indicators folder and start ATAS X.
- 03Add quantedOptions Profile from the chart's Indicators list, paste your key in the connection settings and leave Source and Conversion on AUTO.
Reading
How to read it
- Read the footprint at a node: the traded volume and the market-maker gamma sit on the same price row.
- A node building shows in the panel first: watch 'Highest Positive GEX' and the Change rows climb as price approaches.
- With ES and NQ side by side, each panel names its own model.
- Settings group 1 is Connection; groups 2 to 6 hold the bar look, the panel and the change windows.
Settings
What each setting does
| Setting | Options | What it changes |
|---|---|---|
| Indicator settings, group 1. Connection | API key, Options underlying AUTO, Price conversion AUTO, Book | The key and the AUTO settings. |
| Indicator settings, groups 2 to 6 | bar look, panel, change windows | The same settings as every other platform. |
Read it with
- The data panel — the regime, the nearest nodes, the top strikes and what changed, in one corner
- Gamma nodes at the strikes — one bar per strike: positive nodes slow price, negative nodes let it through
- Instruments: one key, every family — eS from SPX with CBOE signed market-maker data; every other family its own levels
Good to know
- The same file runs on Windows and on macOS.
- Use a real-time data connection so the nodes sit on the live price.
On a real chart
See it happen
ATAS X · ES: the Profile beside the chart, nodes labelled in dollars, both straddle edges labelled in points and dollars, and the panel bottom-left. Point at the largest positive node above price and watch price slow as it arrives.
11 slides
The walk-through, slide by slide
Slide 1 / 11
These pages describe what the displays show and what the data did on the sessions shown. They are not trading advice, and a past session is not a forecast of a future one.