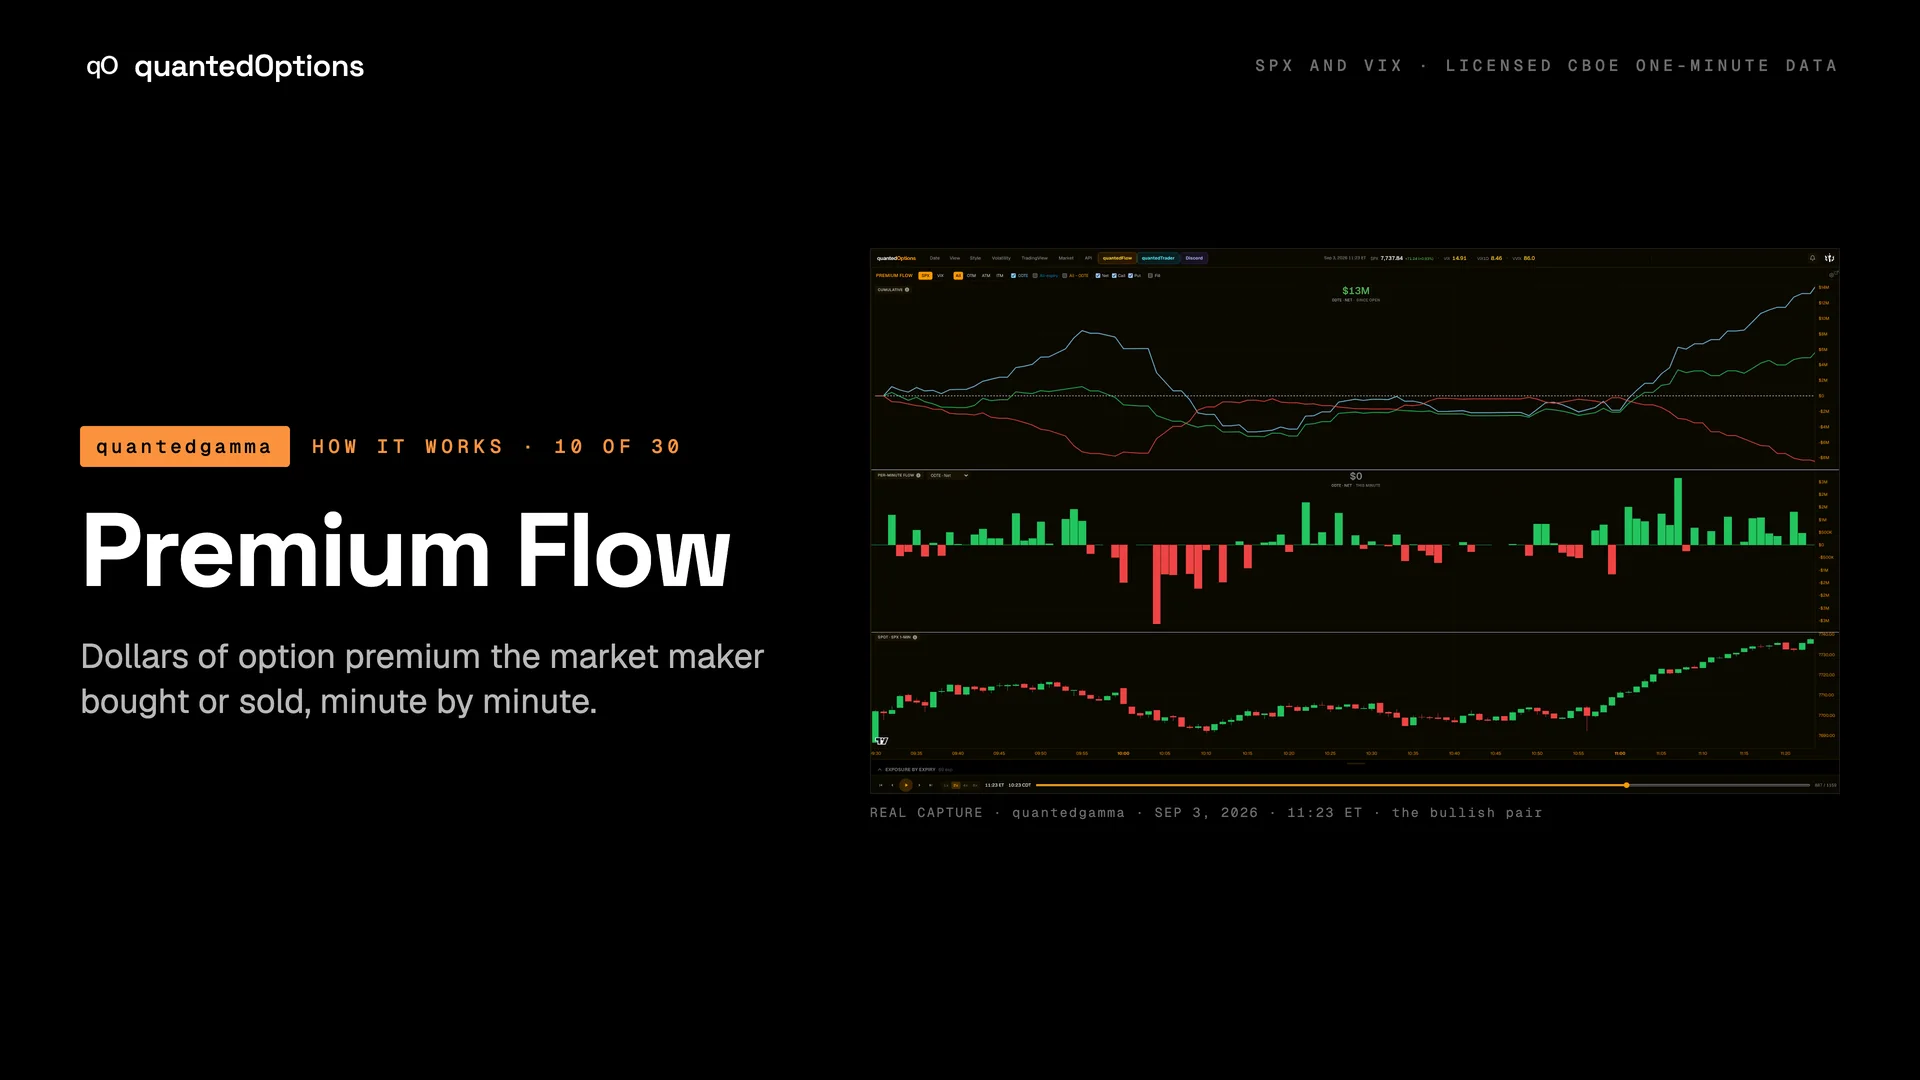
Premium Flow
Dollars of option premium the market maker bought or sold, minute by minute.
What it shows
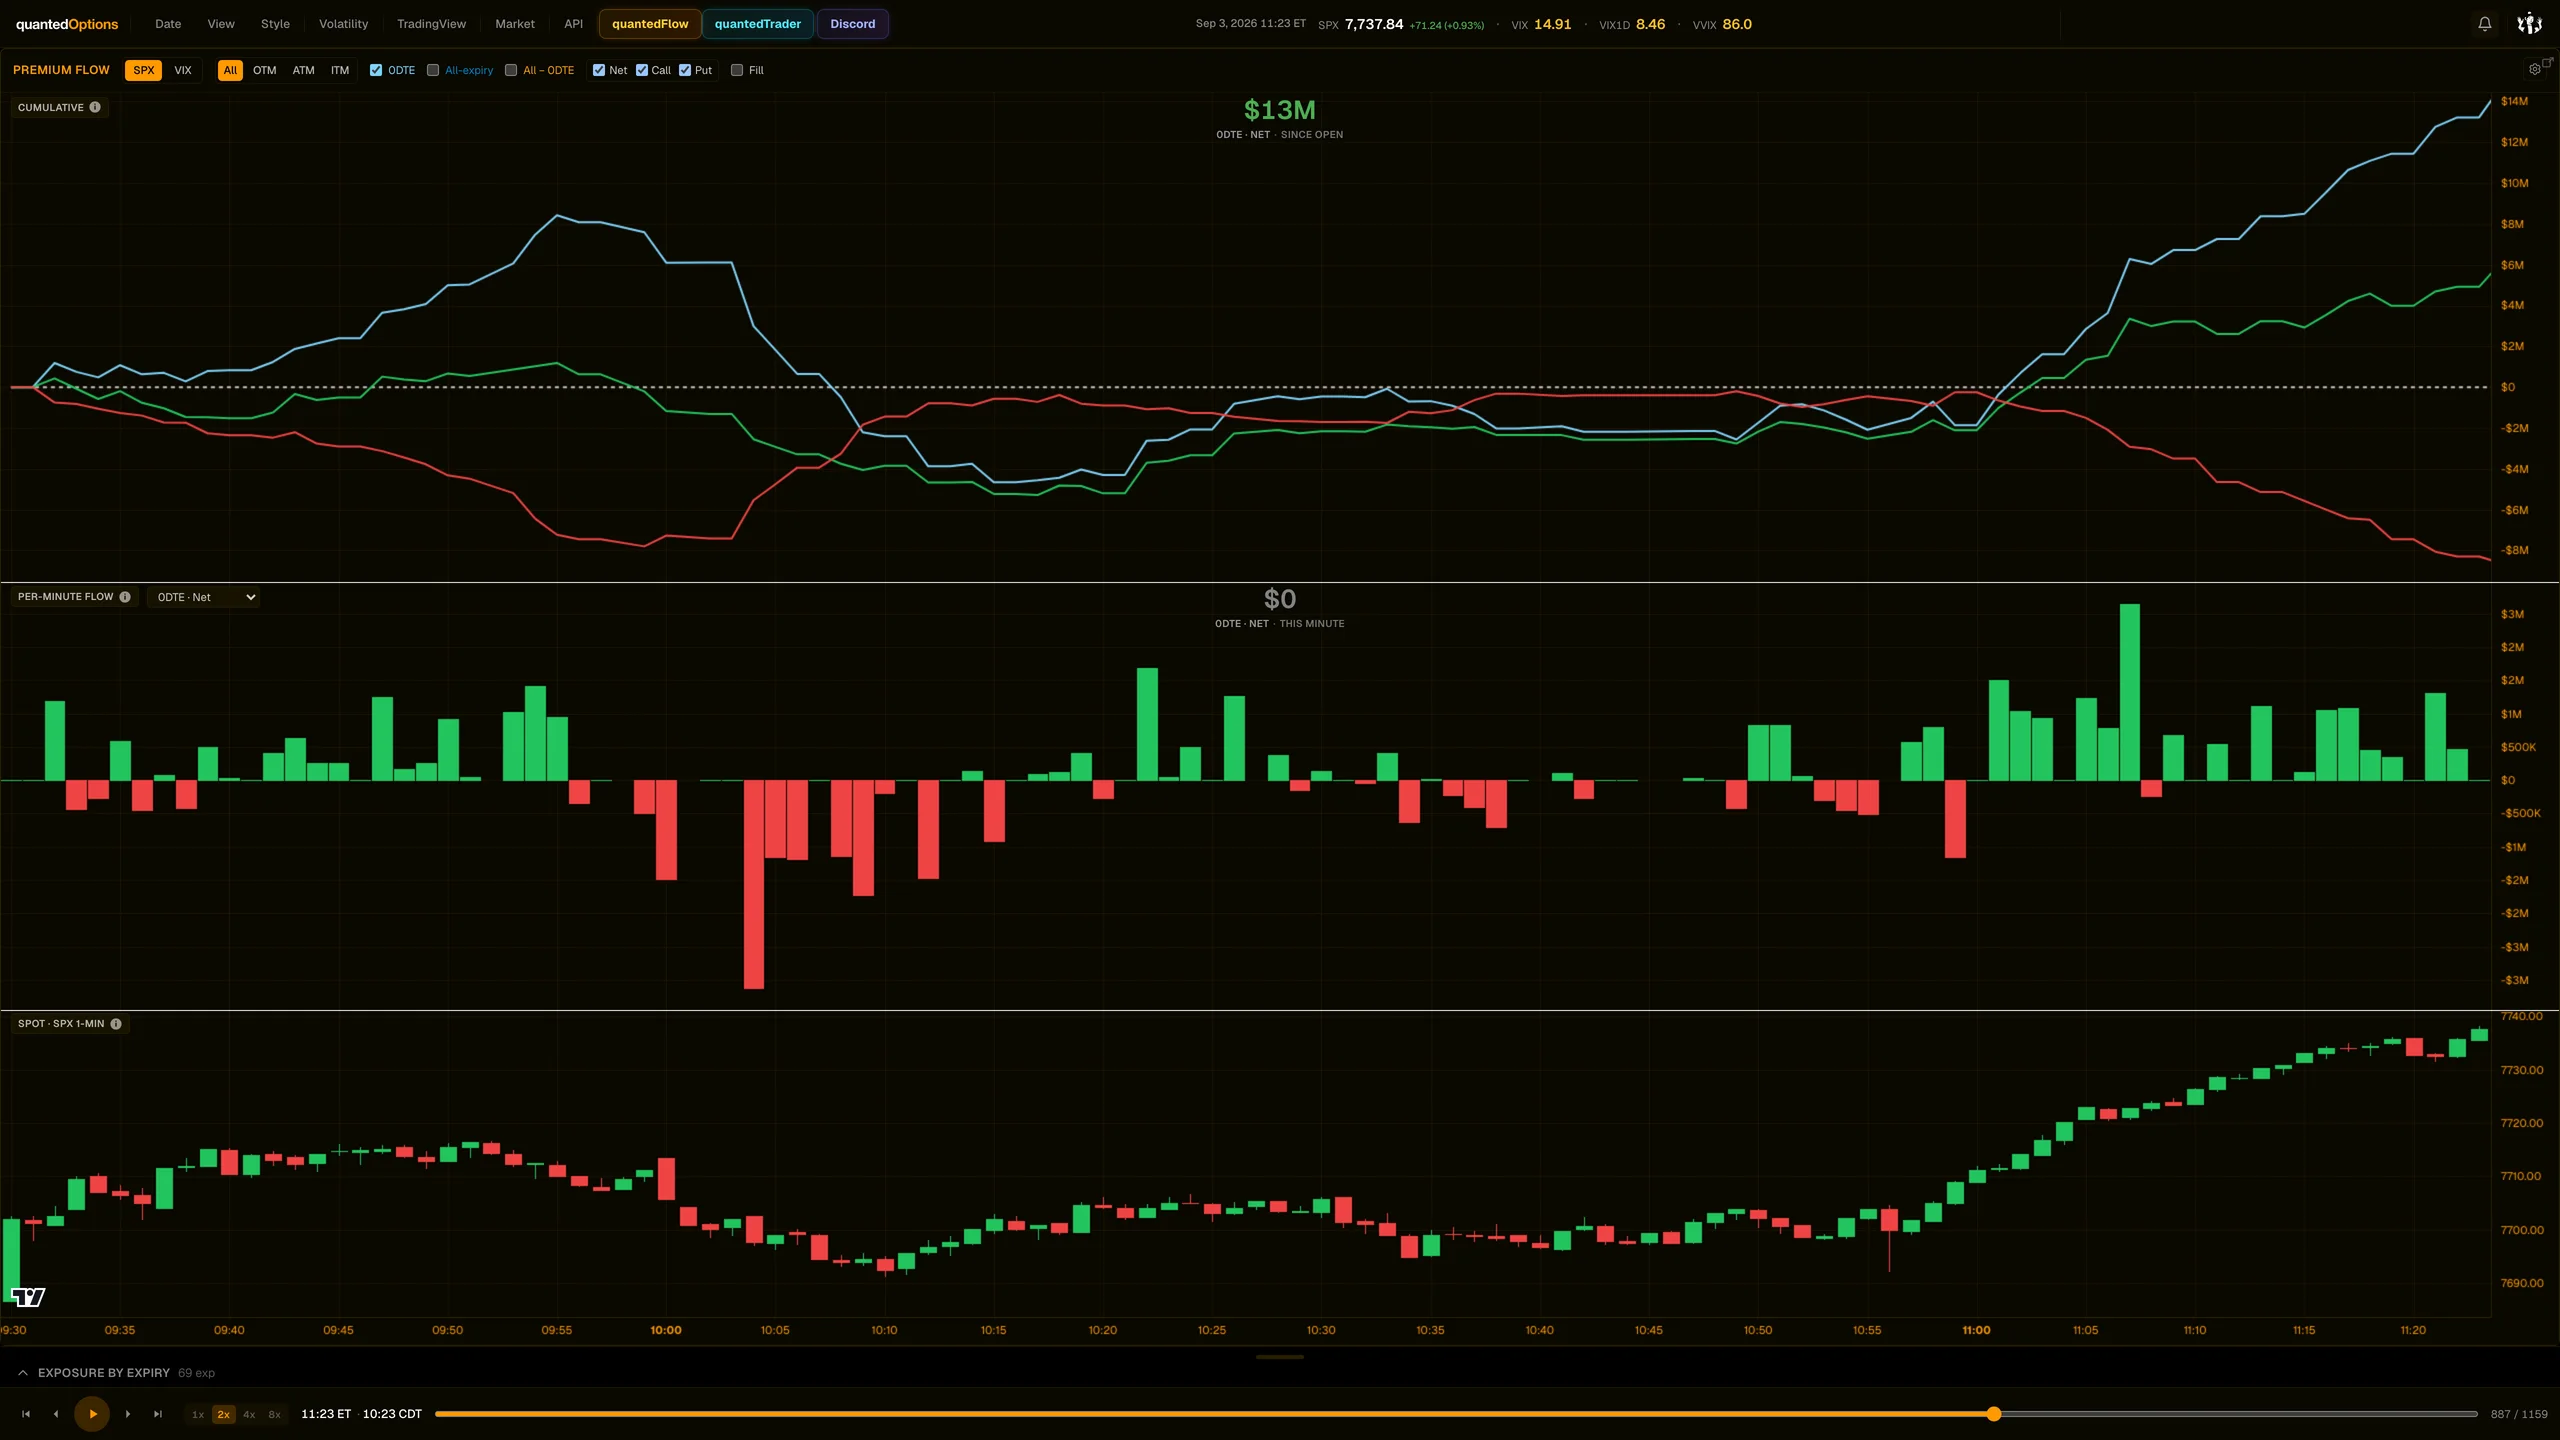
Three panes on one time axis: 'Cumulative' lines (running premium since 09:30 ET, with a 'SINCE OPEN' readout), a 'Per-Minute Flow' histogram ('THIS MINUTE'), and one-minute spot candles. Lines exist for Net, Call and Put, for each expiry cohort. It is the MARKET MAKER's book.
What it is built from
Each minute: the premium the market maker paid or received, calls and puts separately, added up since the open. Built from licensed CBOE one-minute SPX and VIX data with market-maker positioning, recomputed every minute.
Reading
How to read it
- Call line rising means market makers BOUGHT calls; call line falling means market makers SOLD calls.
- Put line falling means market makers SOLD puts; put line rising means market makers BOUGHT puts.
- Call line up with put line down is the pair that has coincided with rallies in the case-study sessions; call line down with put line up is the bearish mirror.
- Read the pair. On 2026-09-15 both lines fell together and the selloff had no follow-through.
- A flat zero bar in the per-minute pane means the market maker's book held steady that minute.
Controls
What each control does
| Control | Options | What it changes |
|---|---|---|
| SPX / VIX | SPX, VIX (default SPX) | Which product's options are measured; the candle pane follows. |
| Moneyness | All, OTM, ATM, ITM (default All) | Keeps only strikes in that group, judged each minute against that minute's spot. |
| Cohort checkboxes | 0DTE (VIX: 'Nearest (Mon D)'), All-expiry, All - 0DTE (default 0DTE only) | Which expiry cohorts are drawn. All - 0DTE is the book beyond today. |
| Side checkboxes | Net, Call, Put (default all on) | Which lines are drawn for each active cohort. |
| Fill | on / off (default off) | Shades the area between each cumulative line and zero. |
| Bars focus dropdown | any cohort and side (default 0DTE - Net) | Which single series the per-minute histogram shows. |
| Gear: Line colors & style | colour, width, line type, fill opacity, zero line | How the lines look; saved in your browser. |
Read it with
- Cumulative Net Delta — the MM calls bought here gain delta as price approaches the strike; that is the 0DTE net delta line climbing
- SPX Strike Profile — the long-call position being bought IS the positive gamma strike building above price
- Gamma Flow By Strike — the third panel of the three-panel flow page
Good to know
- These are the market maker's lines: a rising call line is market makers buying calls.
- Read calls and puts together: the pair is the signal.
- It covers regular hours, from 09:30 ET.
- On VIX the front cohort is the nearest expiry, labelled with its date.
A real session
See it happen
11:23 ET
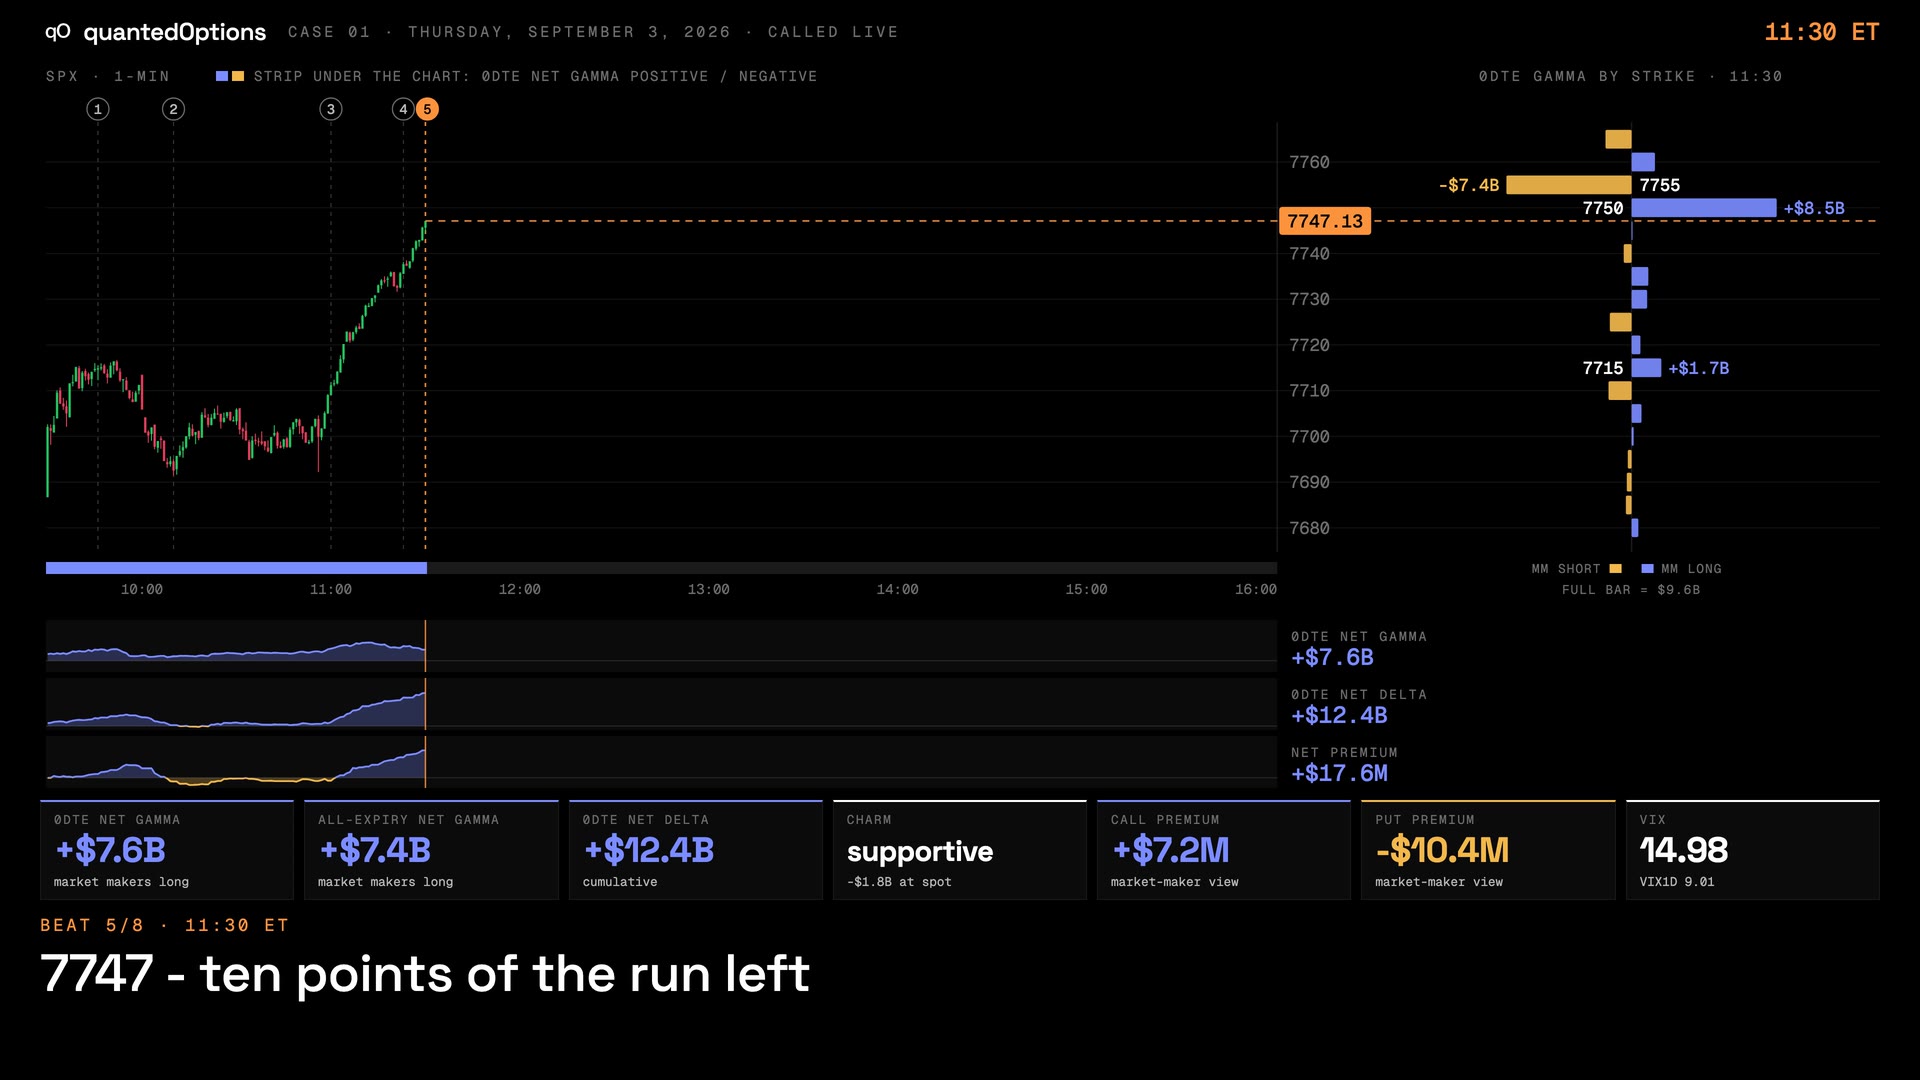
11:00 -> 11:23: call line -$2.1M to +$4.9M, put line -$0.3M to -$8.3M (MM bought calls, sold puts) while 7750 went to +$8.7B and price ran 7711 -> 7747 by 11:30.
Case 01 · Sep 3, 2026
Calls bought, puts sold, net delta at the highs: the run to 7750
13 slides
The walk-through, slide by slide
Slide 1 / 13
From the product
Real frames
Shot off the live product, nothing redrawn. Click the right side of a frame for the next one, the left side to go back.
Product frame 1 / 11
These pages describe what the displays show and what the data did on the sessions shown. They are not trading advice, and a past session is not a forecast of a future one.