quantedOptions Profile on your own futures chart
Market-maker gamma levels, drawn on the futures chart you already trade.
What it shows
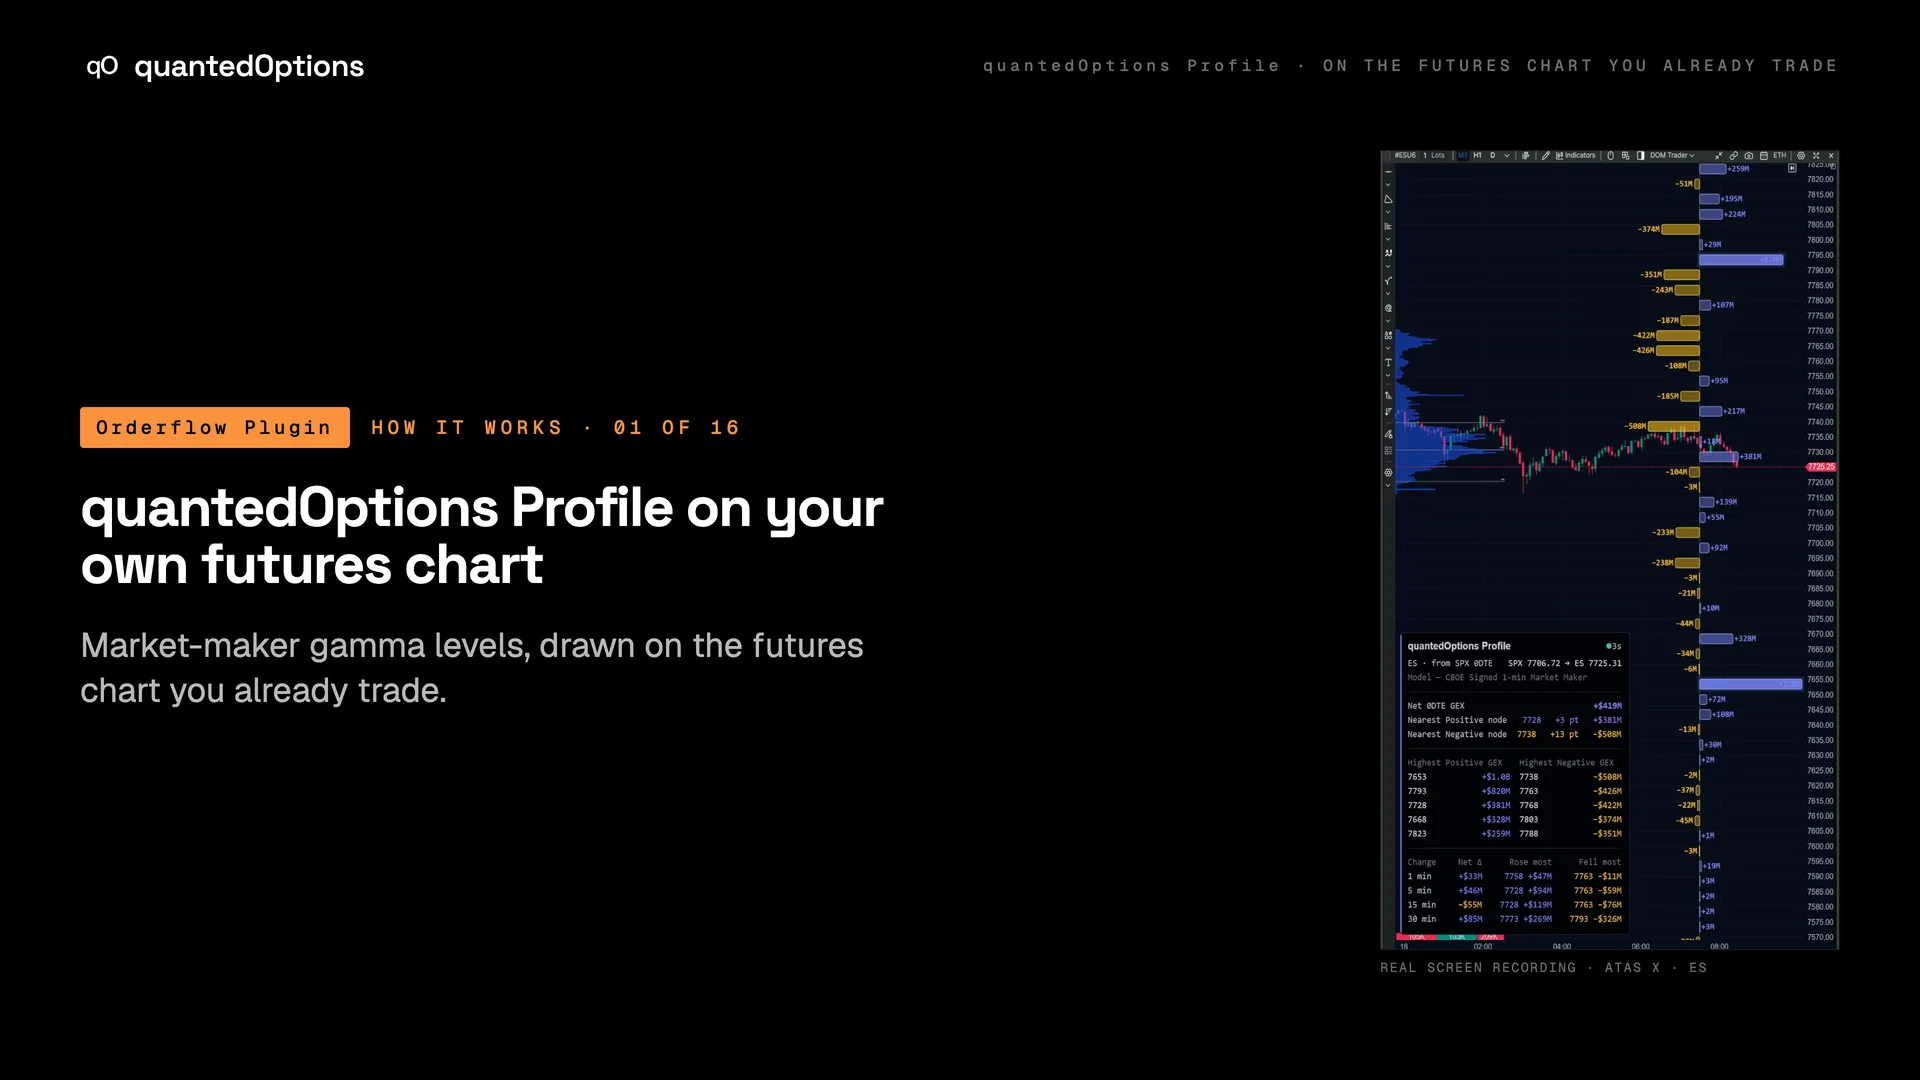
quantedOptions Profile is the Orderflow Plugin's on-chart study. It draws a ladder of exposure bars at the right of your chart, one per strike and placed at the futures price, with the live ATM straddle band and a small data panel in a chart corner. It runs inside Bookmap, MotiveWave, NinjaTrader 8, ATAS X, Quantower and Sierra Chart, and a TradingView overlay is included with every key.
What it is built from
On ES and MES: licensed CBOE one-minute data with market-maker positioning, from SPX, computed and delivered every minute. On the other families: computed from data consolidated across every US options exchange: open interest and volume.
Reading
How to read it
- Same reading order as the dashboards: regime, nodes, band, change. 'Net 0DTE GEX' in the panel is the regime.
- The ladder is the book strike by strike: positive bars to the right of the axis, negative to the left.
- The straddle band is the move the options market has priced for the session; the nodes are where the hedging sits around it.
- The panel's first line says what you are looking at: 'ES · from SPX 0DTE 09-03'.
Settings
What each setting does
| Setting | Options | What it changes |
|---|---|---|
| Ladder | Bars, Strip, Off | Bars draws the full ladder; Strip draws the same shape in a slim column; Off leaves the panel and the heatmap bands. |
| Show data panel | on / off (default on) | Shows or hides the panel in the chart corner. |
| Color theme | Amber, Fiesta, Classic, Emerald, Mono, Custom | The colours of the bars; Custom uses your own positive and negative colours for GEX, CEX, VEX and DEX. |
Read it with
- SPX Strike Profile — the same SPX market-maker book as a dashboard ladder; the Profile puts it at ES prices on your own chart
- Gamma nodes at the strikes — one bar per strike: positive nodes slow price, negative nodes let it through
- The data panel — the regime, the nearest nodes, the top strikes and what changed, in one corner
Good to know
- A standalone product: $99 a month with two platforms of your choice, any other platform for $9 a month, and TradingView included with every key.
- quantedUltra includes the plugin on all six platforms.
- Add the study once and it keeps itself current every minute, day and night.
On a real chart
See it happen
11:23 ET
SPX 7750 (the ES equivalent on the chart) at +$8.7B, the largest positive node above price. Price went 7711 to 7747 by 11:30 and spent four hours under it: the target, then the ceiling.
11 slides
The walk-through, slide by slide
Slide 1 / 11
These pages describe what the displays show and what the data did on the sessions shown. They are not trading advice, and a past session is not a forecast of a future one.