Strike Gamma - Session
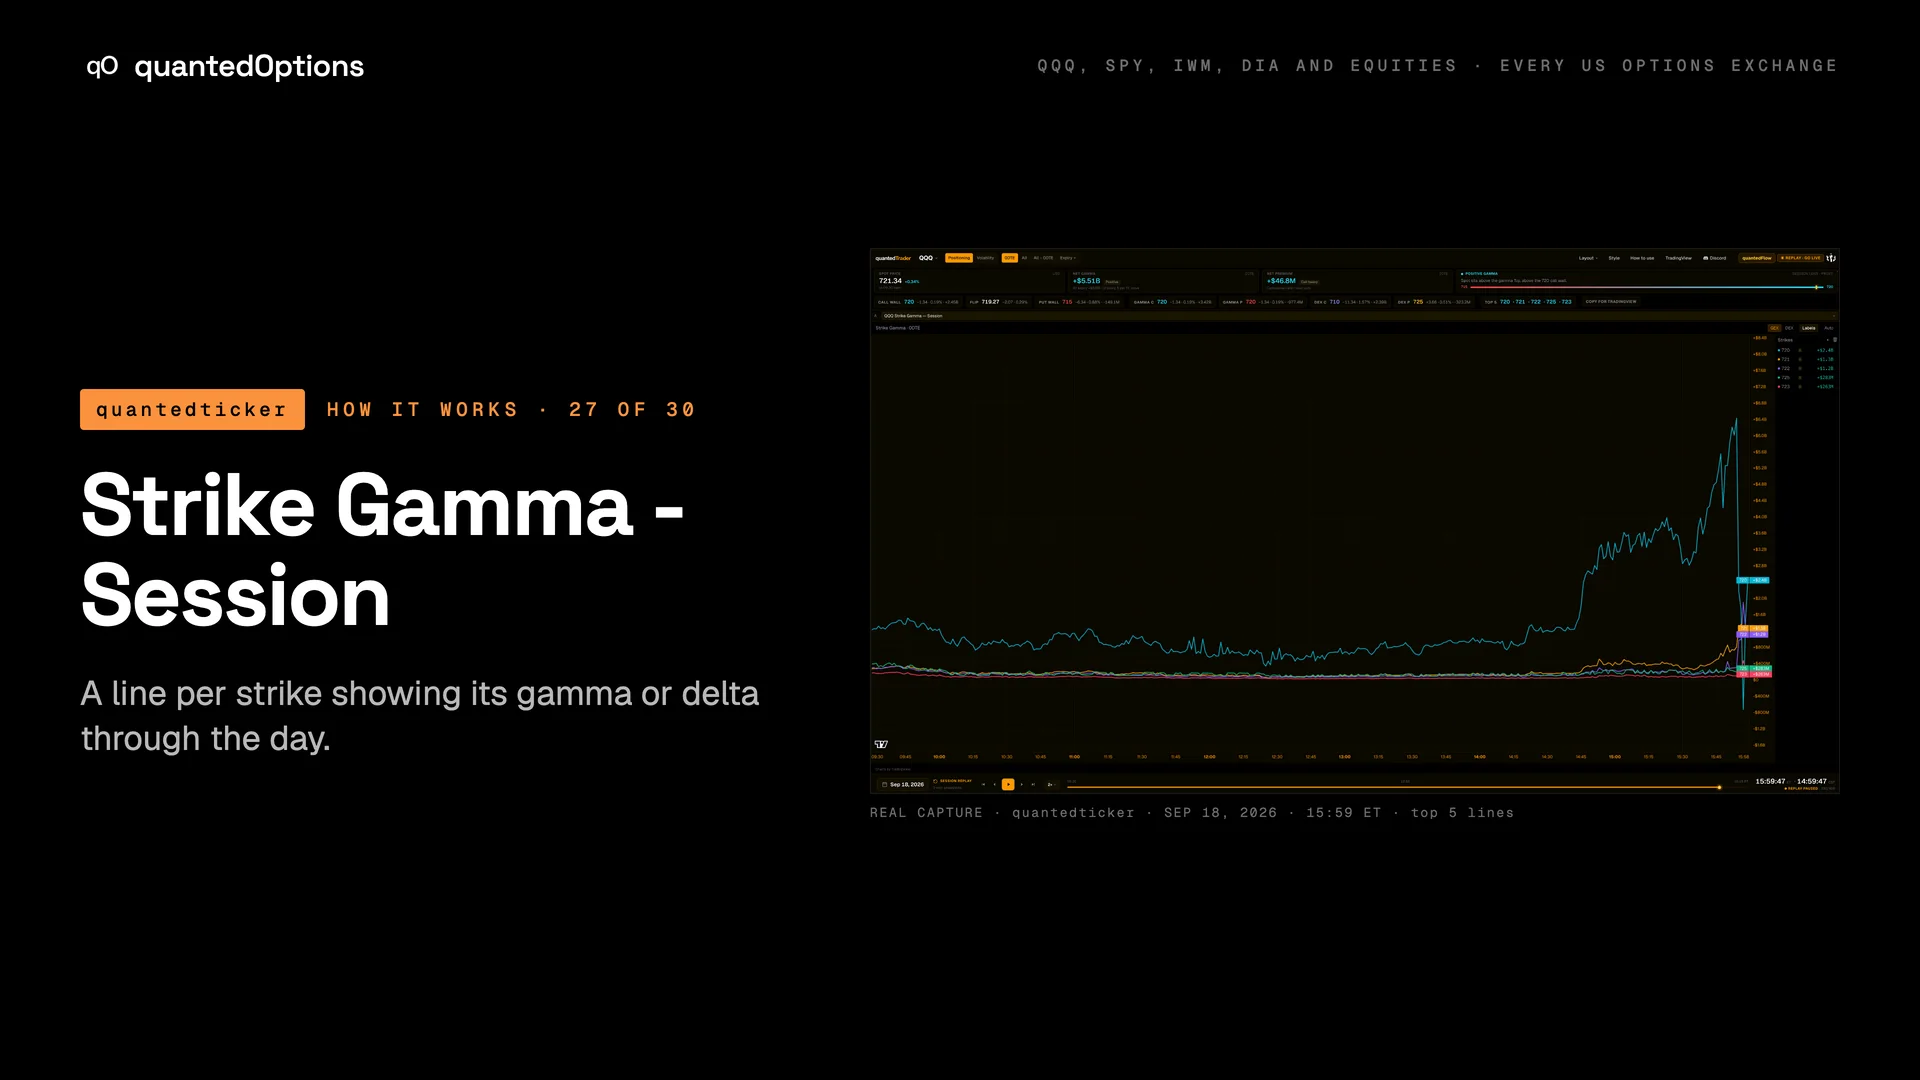
A line per strike showing its gamma or delta through the day.
What it shows
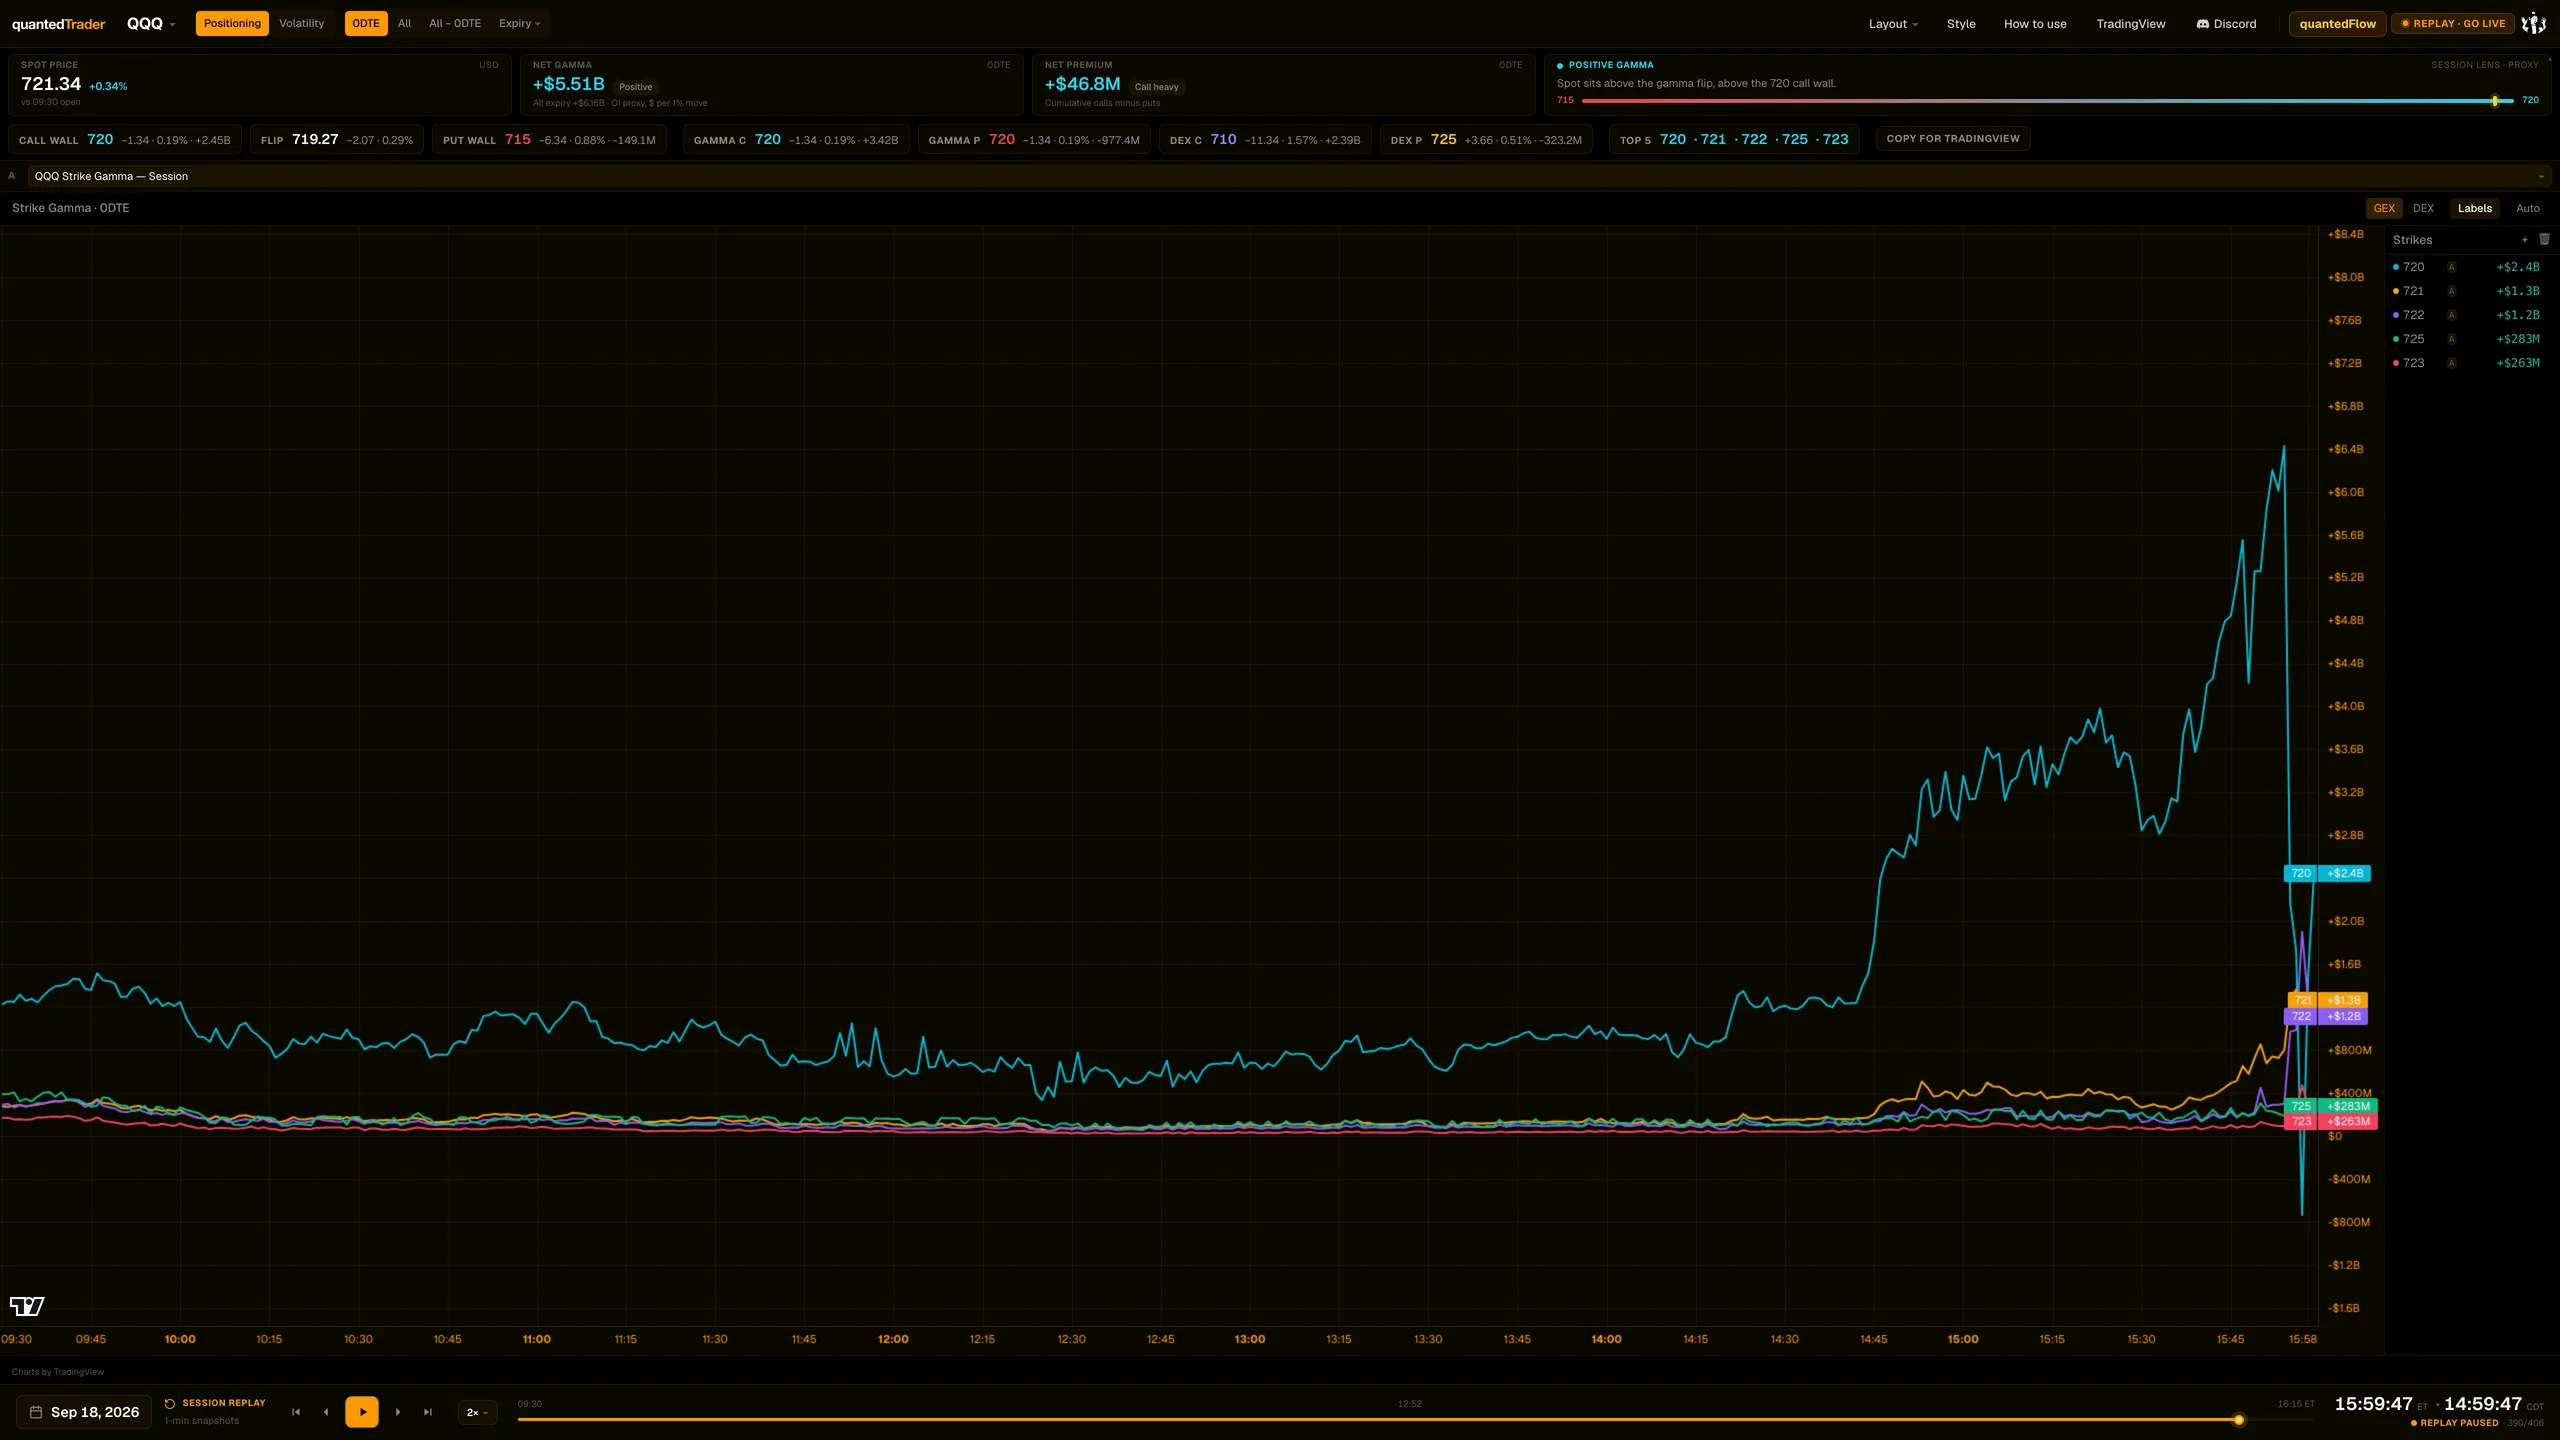
Lines for a tracked set of strikes across regular hours, cut at the replay minute. It seeds itself with the five strikes of largest positive net gamma and reseeds when the ticker or expiry cohort changes.
What it is built from
Each tracked strike's gamma or delta exposure, minute by minute through regular hours. Computed from data consolidated across every US options exchange: open interest and volume.
Reading
How to read it
- A rising line means that strike's gamma is growing, mostly as price moves toward it or expiry gets nearer.
- Lines crossing show the lead strike changing.
- The line ends at the minute on screen, so scrubbing shows what was known then.
Controls
What each control does
| Control | Options | What it changes |
|---|---|---|
| GEX | DEX | two metrics | Which exposure is plotted. |
| Labels | on / off | Strike labels at the line ends. |
| Auto / + / x / clear | reseed top 5; search and add a strike; remove one; clear all | Manage tracked strikes. |
Read it with
Good to know
- Open interest holds still through the session, so these lines trace how price and time move each strike's exposure.
A real session
See it happen
15:59 ET
QQQ 2026-09-18, full session.
9 slides
The walk-through, slide by slide
Slide 1 / 9
From the product
Real frames
Shot off the live product, nothing redrawn. Click the right side of a frame for the next one, the left side to go back.
Product frame 1 / 3
These pages describe what the displays show and what the data did on the sessions shown. They are not trading advice, and a past session is not a forecast of a future one.