Net Delta - Session
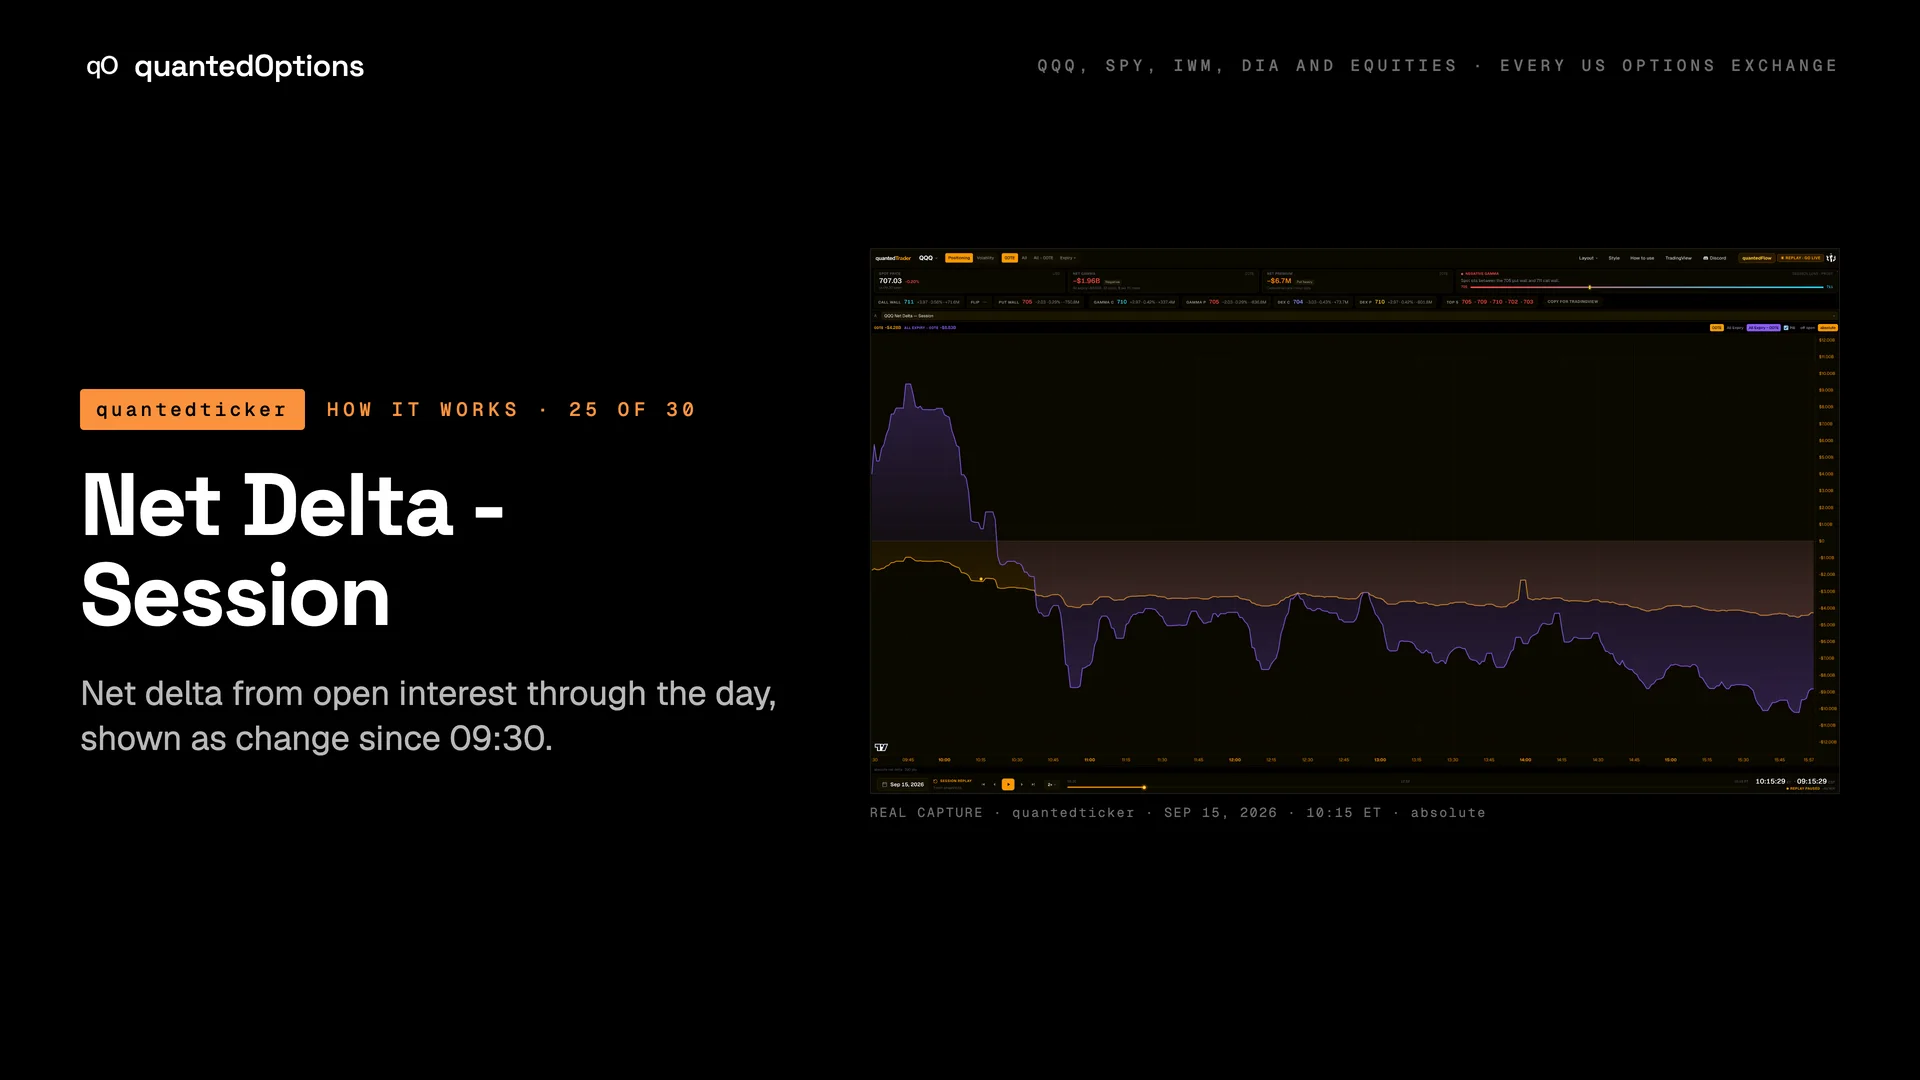
Net delta from open interest through the day, shown as change since 09:30.
What it shows
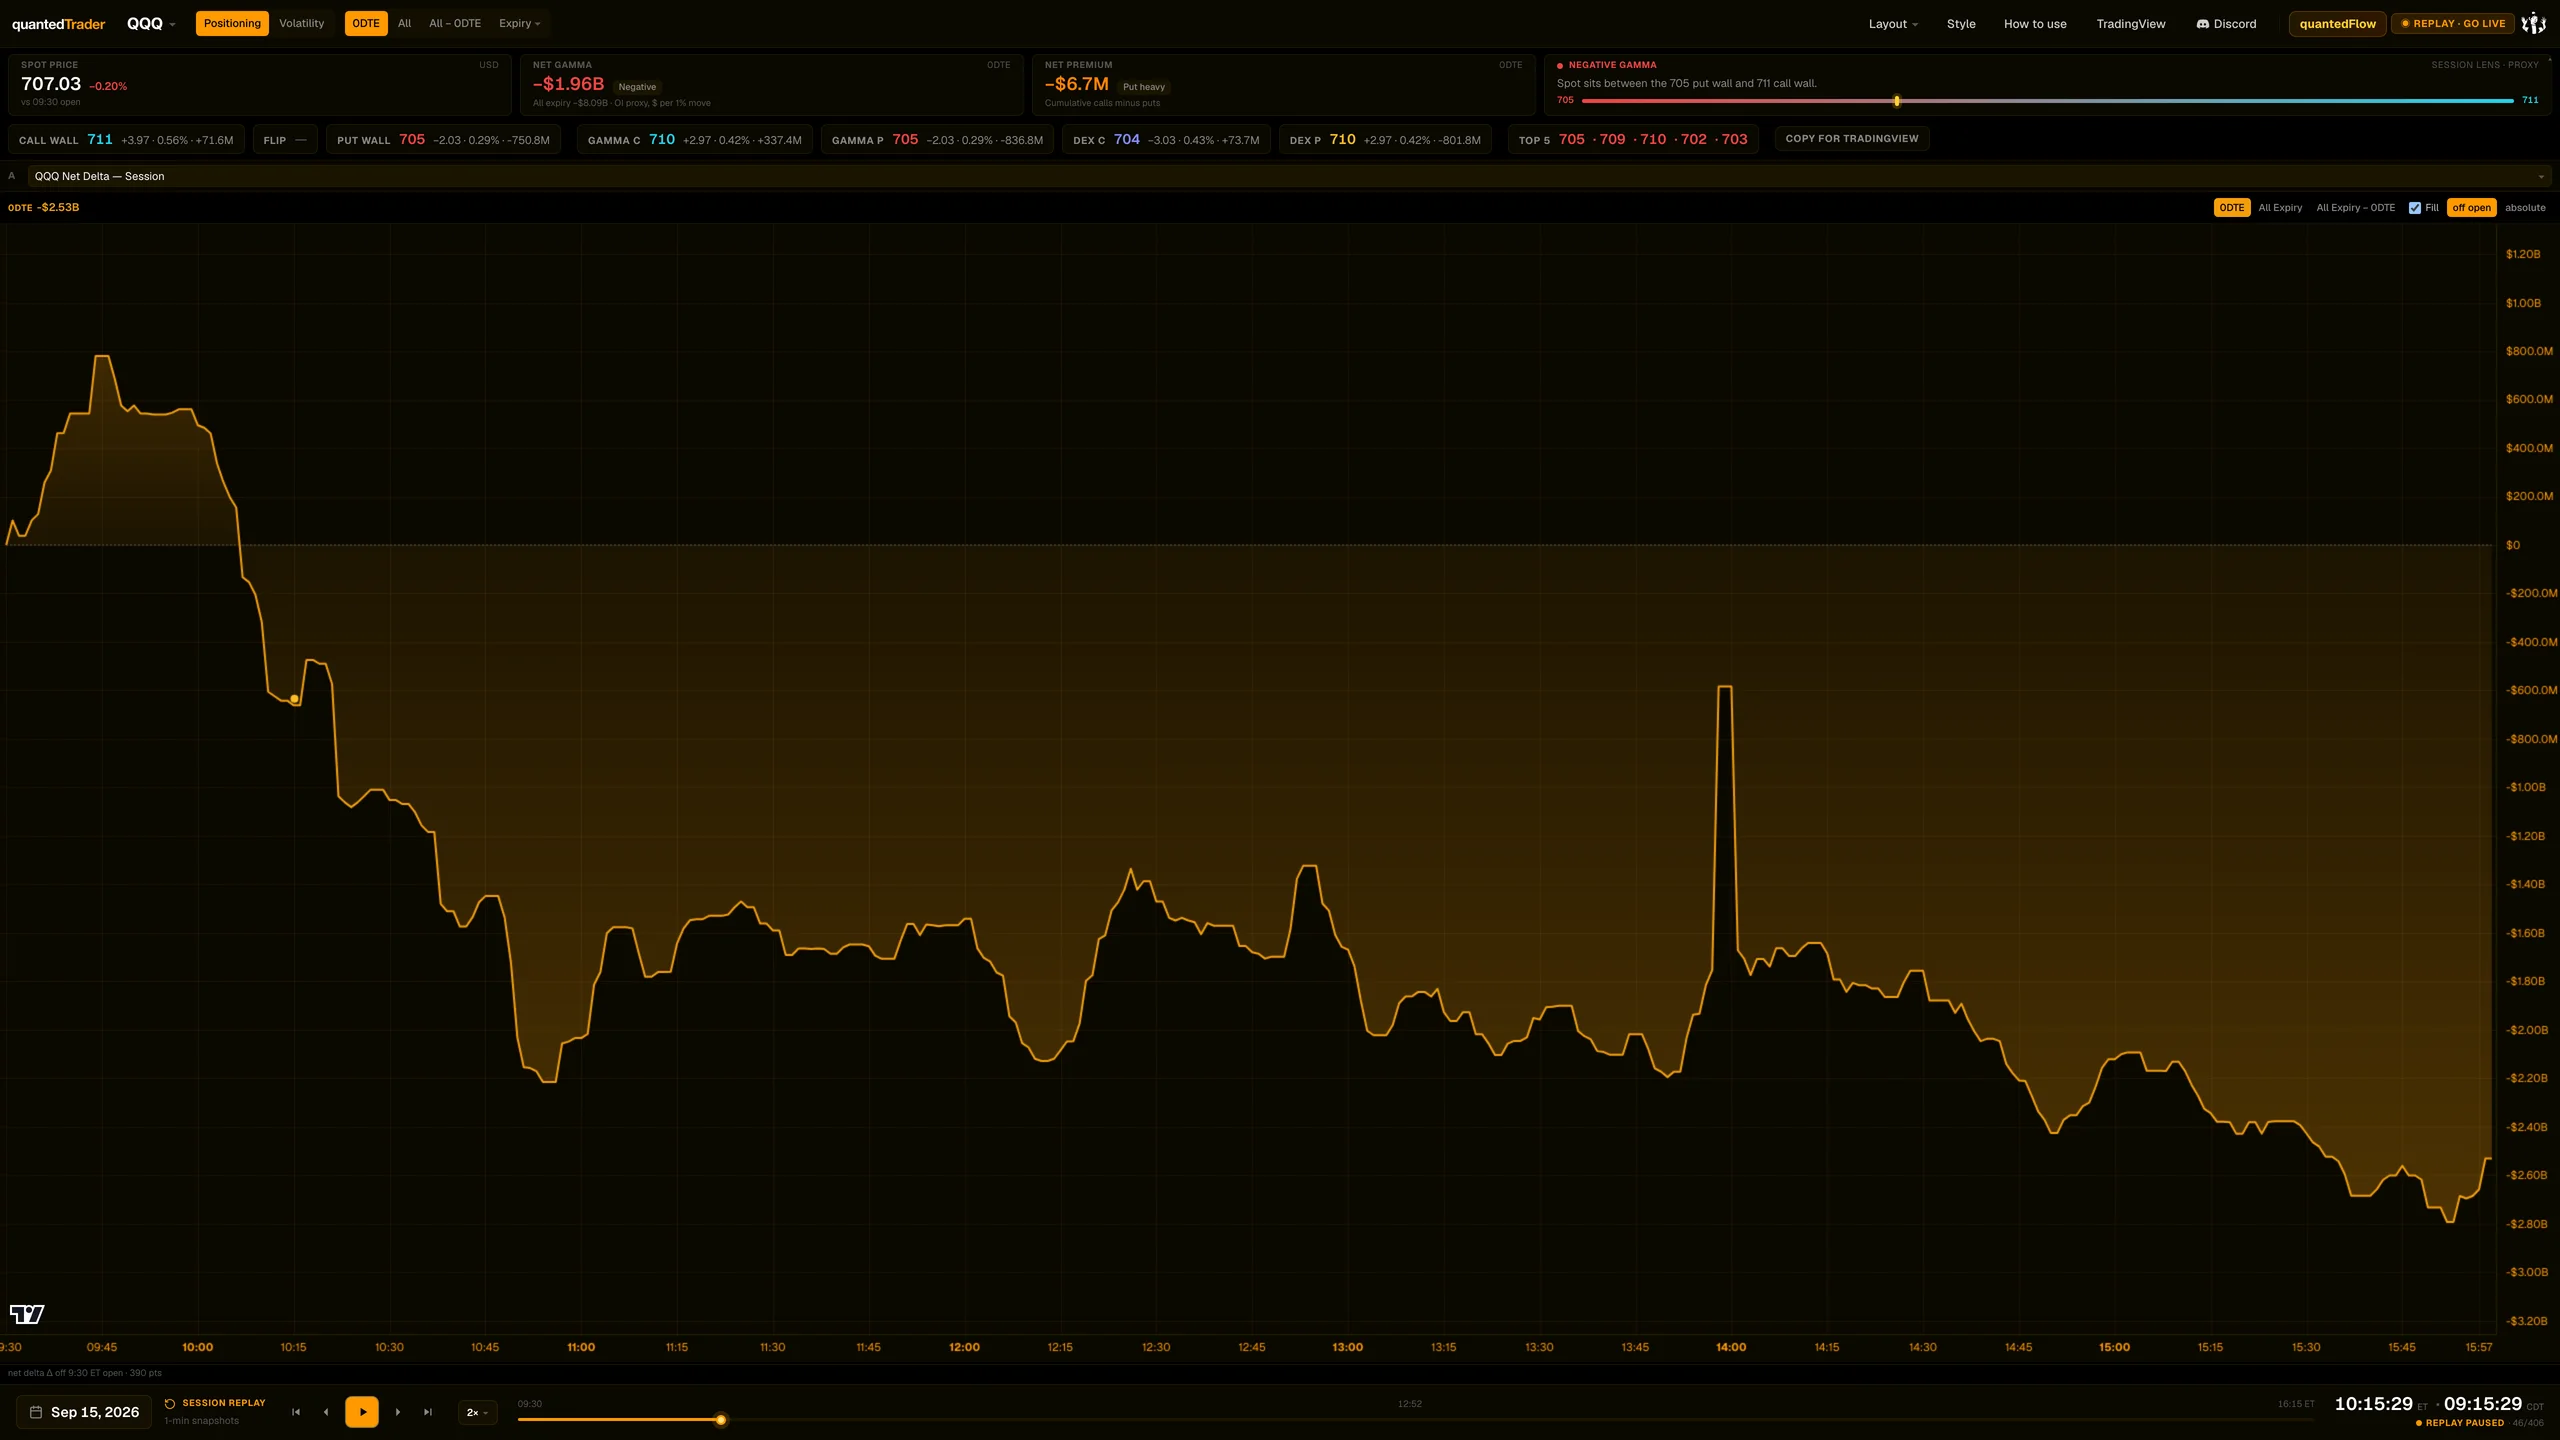
One line per cohort (0DTE, All Expiry, All Expiry - 0DTE) of total dollar delta at each minute of regular hours. An amber dot marks the minute on screen.
What it is built from
Dollar delta across the ticker's open interest, totalled at each minute of regular hours. Computed from data consolidated across every US options exchange: open interest and volume.
Reading
How to read it
- Each point is the level of net delta at that minute.
- Open interest holds still through the session, so the line moves as price and deltas move.
- 'off open' starts at zero at 09:30; a cross under zero means net delta is below where it opened.
- 'absolute' shows the dollar total.
Controls
What each control does
| Control | Options | What it changes |
|---|---|---|
| Cohorts | 0DTE, All Expiry, All Expiry - 0DTE | Which lines are drawn. |
| off open | absolute | off open, absolute | Change since 09:30, or the dollar total. |
| Fill | on / off | Shades to zero. |
Read it with
- Price x Gamma — price beside it
- Strike Profile (DEX metric)
Good to know
- It has its own cohort toggles, separate from the menu bar's expiry choice.
- The amber dot marks the minute on screen.
A real session
See it happen
10:15 ET
QQQ 2026-09-15: net delta crosses under zero (off open) at 10:15, then a 1.3-point range for five hours.
12 slides
The walk-through, slide by slide
Slide 1 / 12
From the product
Real frames
Shot off the live product, nothing redrawn. Click the right side of a frame for the next one, the left side to go back.
Product frame 1 / 4
These pages describe what the displays show and what the data did on the sessions shown. They are not trading advice, and a past session is not a forecast of a future one.