Premium Flow is the market maker's book
And why that view lines up with price.
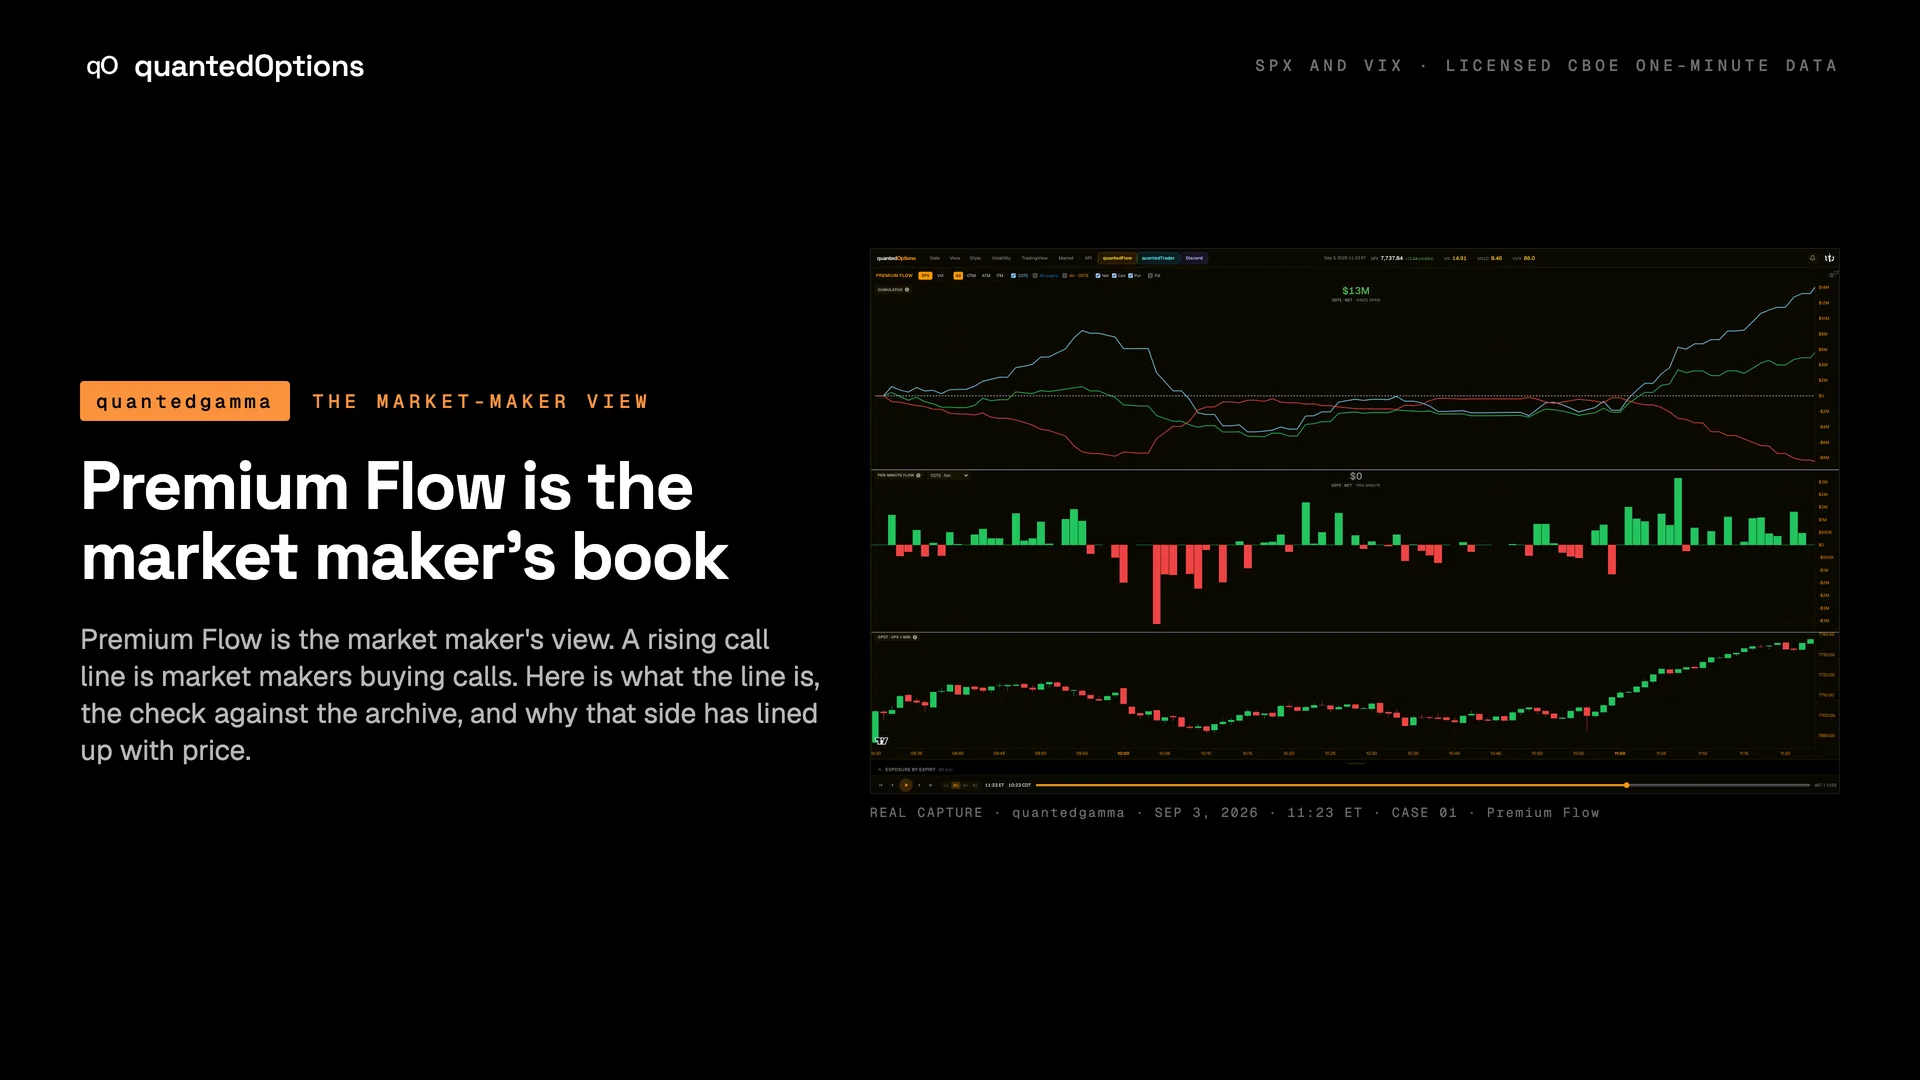
The Premium Flow widget on quantedGamma is the market maker's view. Every premium number in this library is that same view. This page explains what the lines are and why the market-maker side is the one that coincides with what price does.
What the line is
Each minute: the premium the market maker paid or received, calls and puts separately, added up since the open.
- call line rising → market makers bought calls (paid premium)
- call line falling → market makers sold calls (received premium)
- put line falling → market makers sold puts
- put line rising → market makers bought puts
The archive carries every participant class (market maker, firm, broker-dealer, customer, professional customer) and they sum to zero minute by minute — they are the two sides of the same trades.
The check — three windows, premium-weighted position change, $M
| window | who | calls | puts |
|---|---|---|---|
| 09-03, 11:00→11:23 — the run to 7750 | market makers | +7.0 bought | −8.1 sold |
| customers | −10.5 sold | +9.3 bought | |
| professional customers | +3.3 | −1.1 | |
| 09-14, 11:00→12:51 — the reversal leg | market makers | +13.8 | −9.8 |
| customers | −16.8 | +12.3 | |
| 09-04, 09:31→11:11 — the bearish morning | market makers | −12.9 | +5.0 |
| customers | +18.5 | −3.7 |
At the 7750 strike on 09-03 the market-maker call position went from 6,916 to 8,887 contracts in those 23 minutes. Customers went from −5,384 to −7,423.
On 09-04 customers bought $18.5M of calls before lunch. Price fell 44 points and closed 32 lower.
Why the market-maker side is the one that lines up
- Into strength, customers sell calls and buy puts. Overwriting, taking profit on long calls, selling call spreads above the market, buying protection. The other side of every one of those trades is the market maker, who ends up long calls above price and short puts below.
- *That long-call position is* the positive gamma strike.** A strike reads large and positive on the Strike Profile because market makers are long options there. The call line rising and the strike building above price are the same event seen in two widgets — on 09-03, +$7.0M of calls bought and 7750 going from +$1.7B to +$8.7B.
- As price moves toward the strike, those calls gain delta. That is the 0DTE line on Cumulative Net Delta climbing to its high of the day — it is the market maker's side too. On 09-03 it went +$1.4B → +$10.7B in the same 23 minutes.
- The market maker hedges the delta it is gaining by selling into the move, more and more as price nears the strike. Price travels to the strike and then stalls at it. In every bullish case in this library the high printed at, or a few points short of, the strike that was being built.
- The mirror is the bearish day. Market makers selling calls and buying puts (09-04, 06-16): customers are the ones buying calls, the structure is not being built above price, and there is nothing pulling price up.
So the pair the desk reads live — "call buying, put selling" — is the market maker's book filling up with long calls above and short puts below. It is a picture of where the hedging will be, not of who is optimistic.
Good to know
- The widget is a picture of where the hedging will be. Customers selling calls into a rally can be perfectly bullish holders taking profit; it is the positioning that drives the hedging.
- Read the pair. 09-15 had the call line and the put line falling; the bearish pair never completed and the selloff went nowhere.
- "Has coincided with": fifteen live-called sessions and eight from the archive are a set of clear examples, and the playbook has the whole-sample numbers.
10 slides
The same explanation, slide by slide
Slide 1 / 10
These pages describe what the displays show and what the data did on the sessions shown. They are not trading advice, and a past session is not a forecast of a future one.