7675 builds, charm turns supportive, and price is there 35 minutes later
The strike was 21 points above price when it started to grow.
- SPX open
- 7,634.58
- High
- 7,681.19
- Low
- 7,633.62
- Close
- 7,666.68
- 0DTE net gamma positive
- 46%
- All-expiry net gamma positive
- 42%
- VIX open → close
- 16.09 → 15.30
- VIX high
- 16.14
11:30 ET
09:31 ET
of the session's minutes
of the session's minutes
The bullish stack
The story
- VIX weekly expiry was that morning; VIX opened 16.09 and bled to 15.2.
- 10:09 — 7675 had gone from +$1.3B at the open to +$5.2B, all calls. Charm at spot was negative: supportive.
- By 10:44 call premium was +$10.7M and put premium -$21.4M. 0DTE net delta crossed from -$2.9B to +$7.9B.
- Price reached 7680 at 10:44, five points through the strike. The session high, 7681.19 at 11:30, added less than a point. That was the day.
- Then what: two positive strikes, 7650 and 7675, grew to +$11B each and price sat between them for four hours.
Minute by minute
The beats
09:31 ET
session low 7633.62
10:09 ETposted live
the post: 7675 at +$5.2B, charm supportive
10:44 ET
price reaches 7680; calls +$10.7M, puts -$21.4M
11:30 ET
session high 7681.19 — 0.8 above the 10:44 print
13:00 ET
7650 +$11.0B and 7675 +$10.7B bracket price, 7655 -$14.7B between
15:00 ET
pinned at 7663
In #qo-market-data, as it happened
Posted live
7675 gamma markedly higher. In supportive charm now as well.
SPX tag back to 5d SMA. Monitoring if this was the extent of the rally
From the product
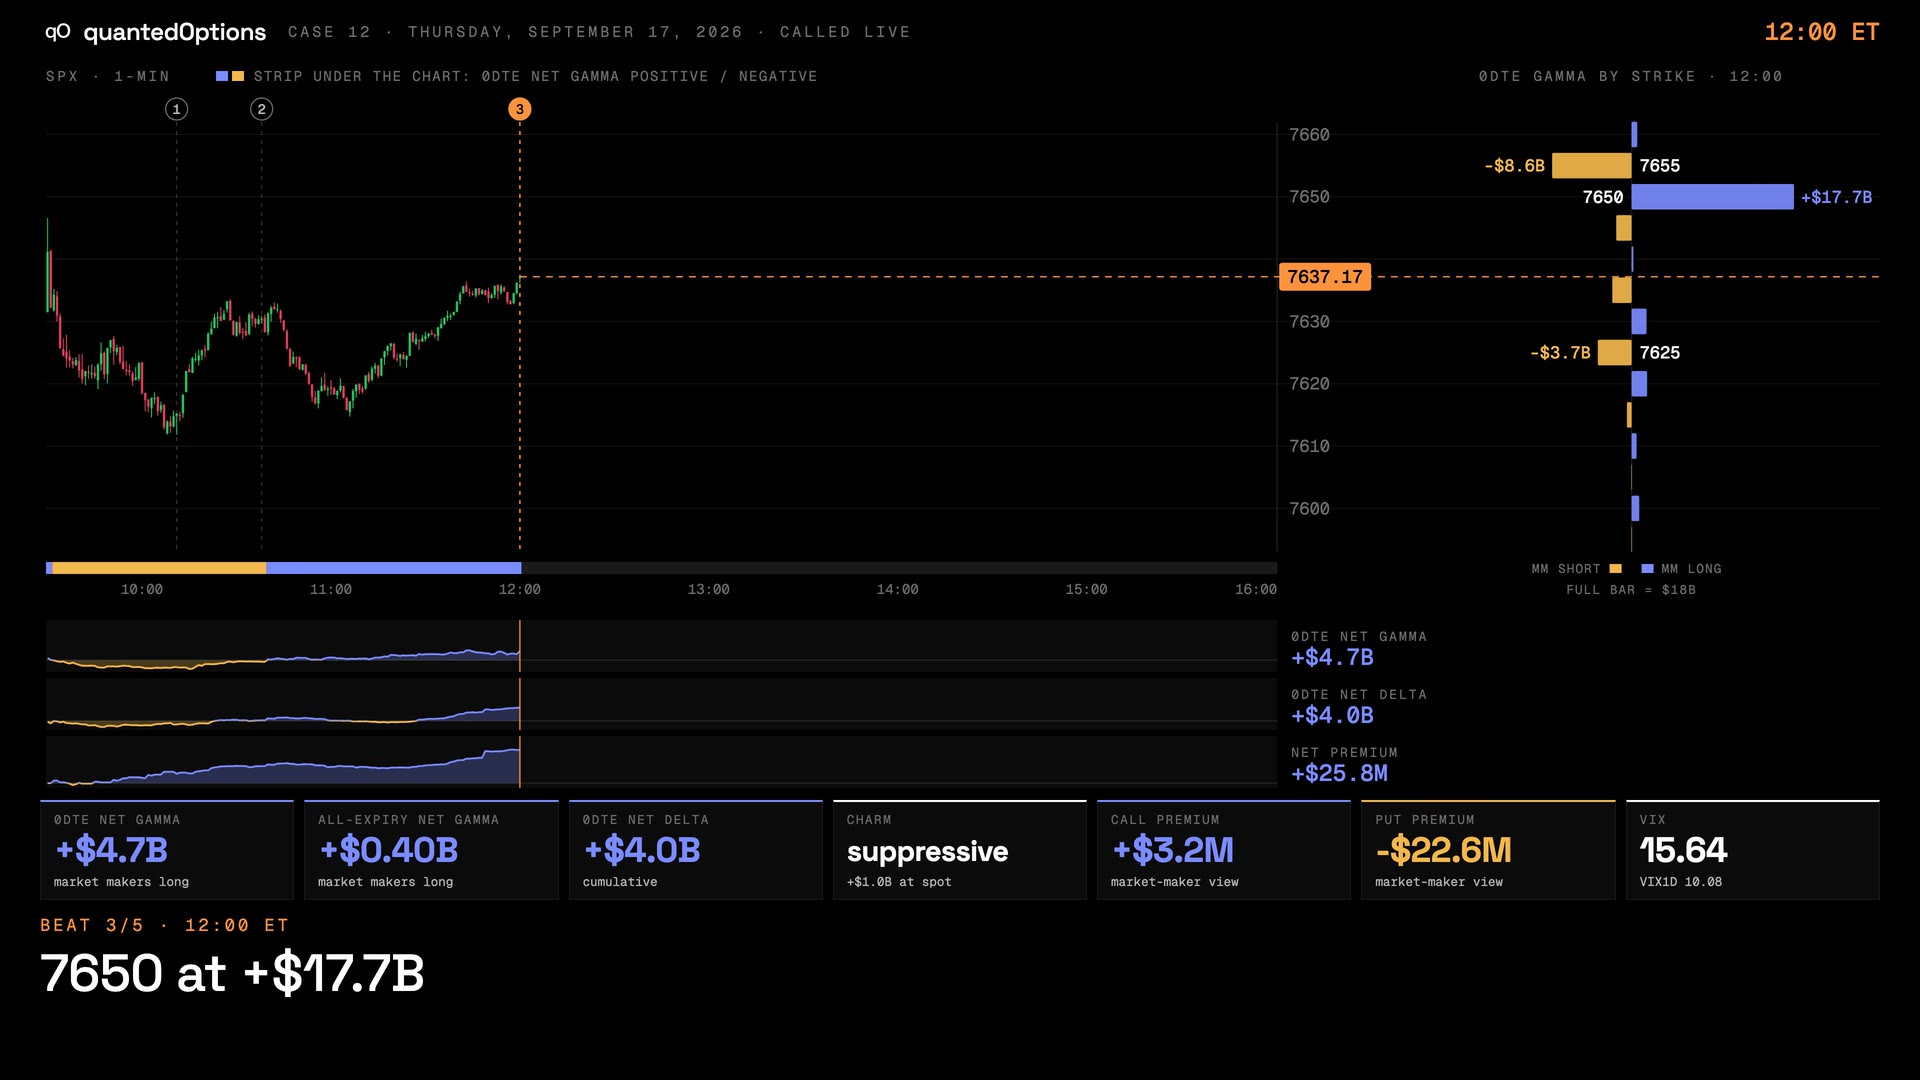
The dashboard at each beat
Premium Flow, Cumulative Net Delta and Gamma Flow By Strike on one screen, replayed to the minute. Real frames, nothing redrawn. Click the right of the frame to step to the next beat.
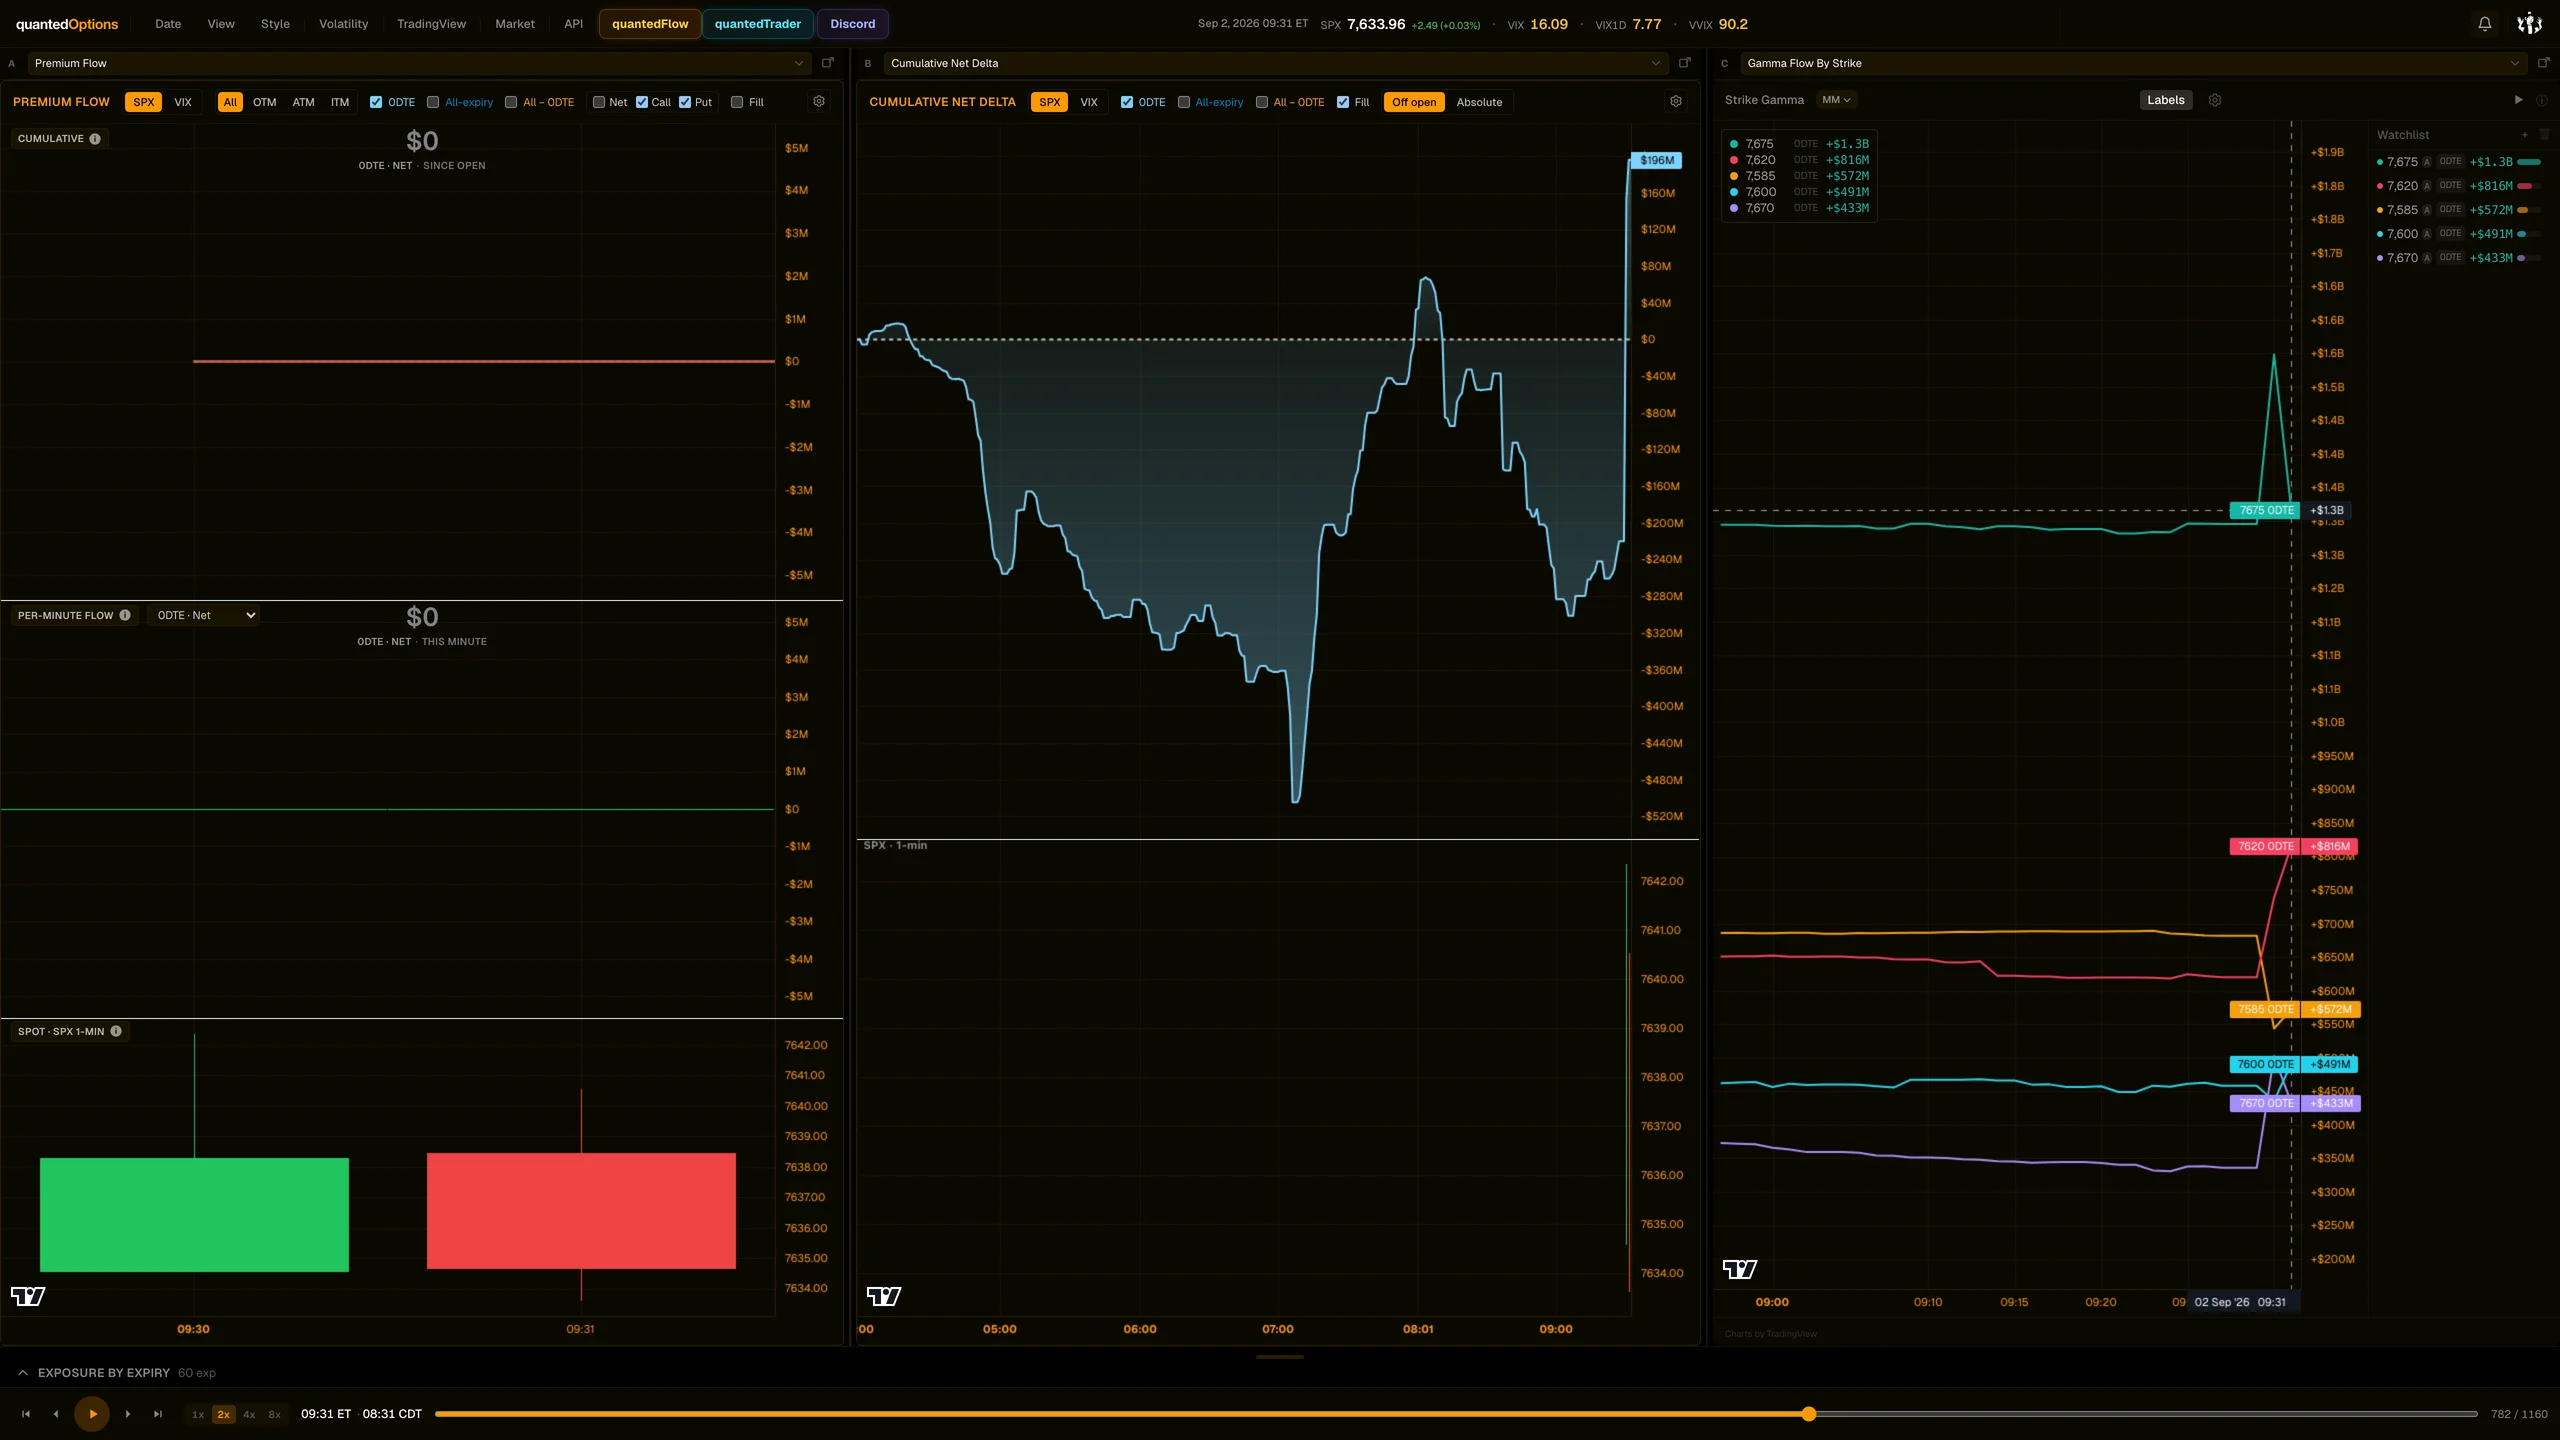
Dashboard frame 1 / 6
09:31 ET — Session low 7633.62
More of this session
The short cut
The short cut
10 slides
The case, slide by slide
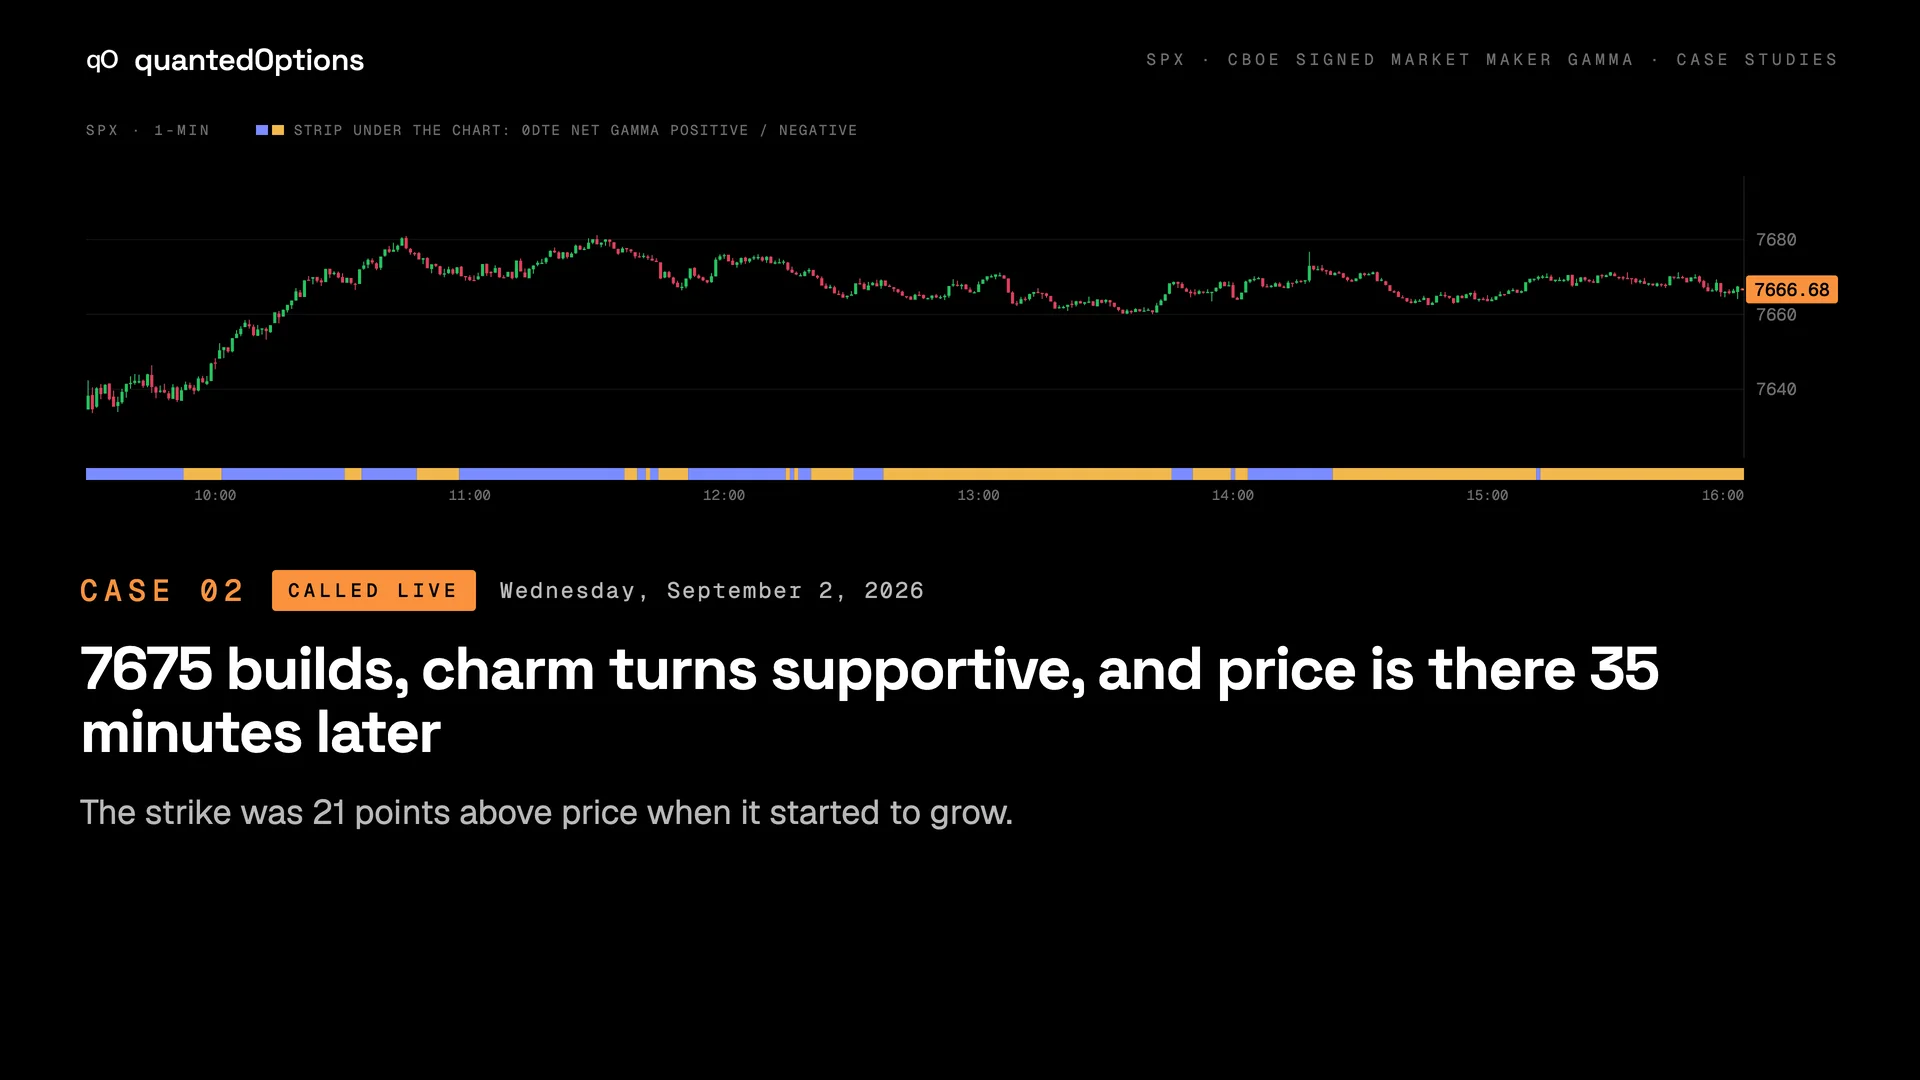
Slide 1 / 10
Same pattern
The bullish stack
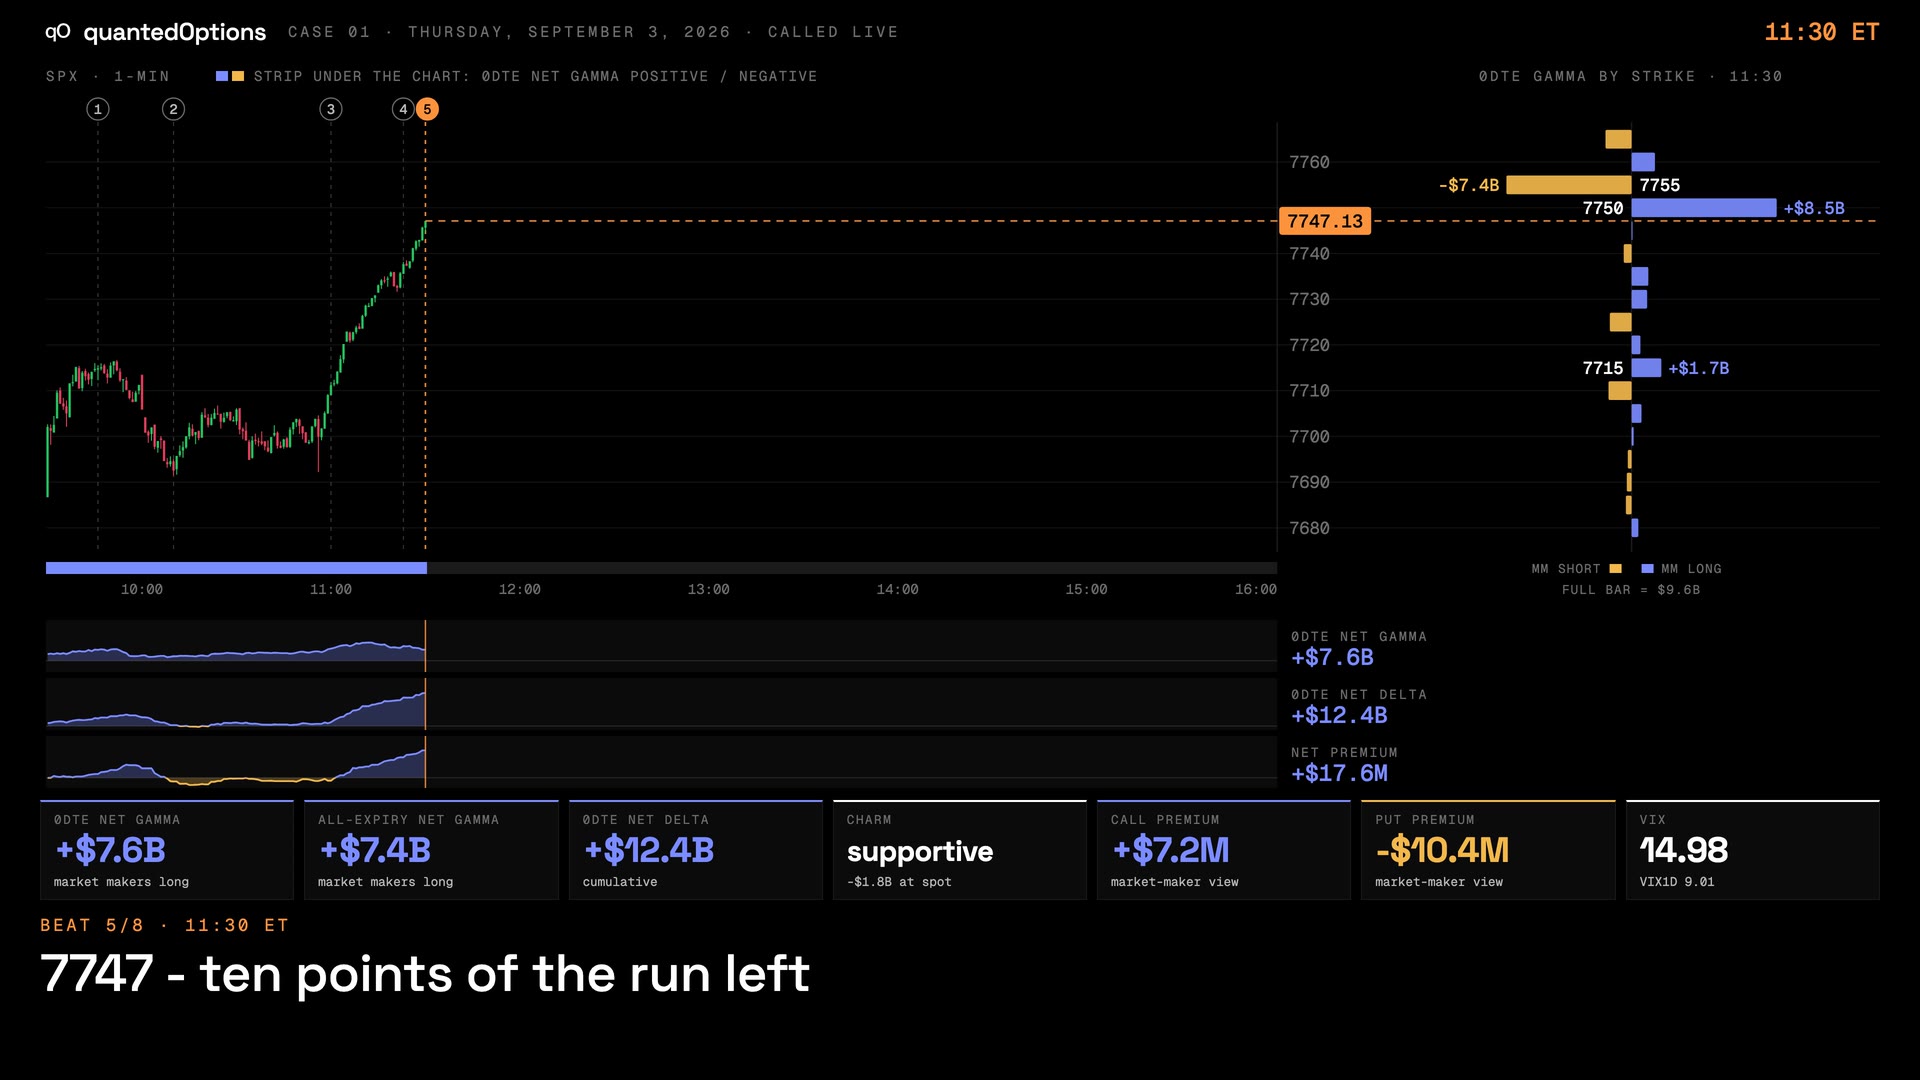 1:16
1:16Calls bought, puts sold, net delta at the highs: the run to 7750
At 11:23 four things lined up on one screen. Seven minutes later price was 35 points higher.
The bullish stack
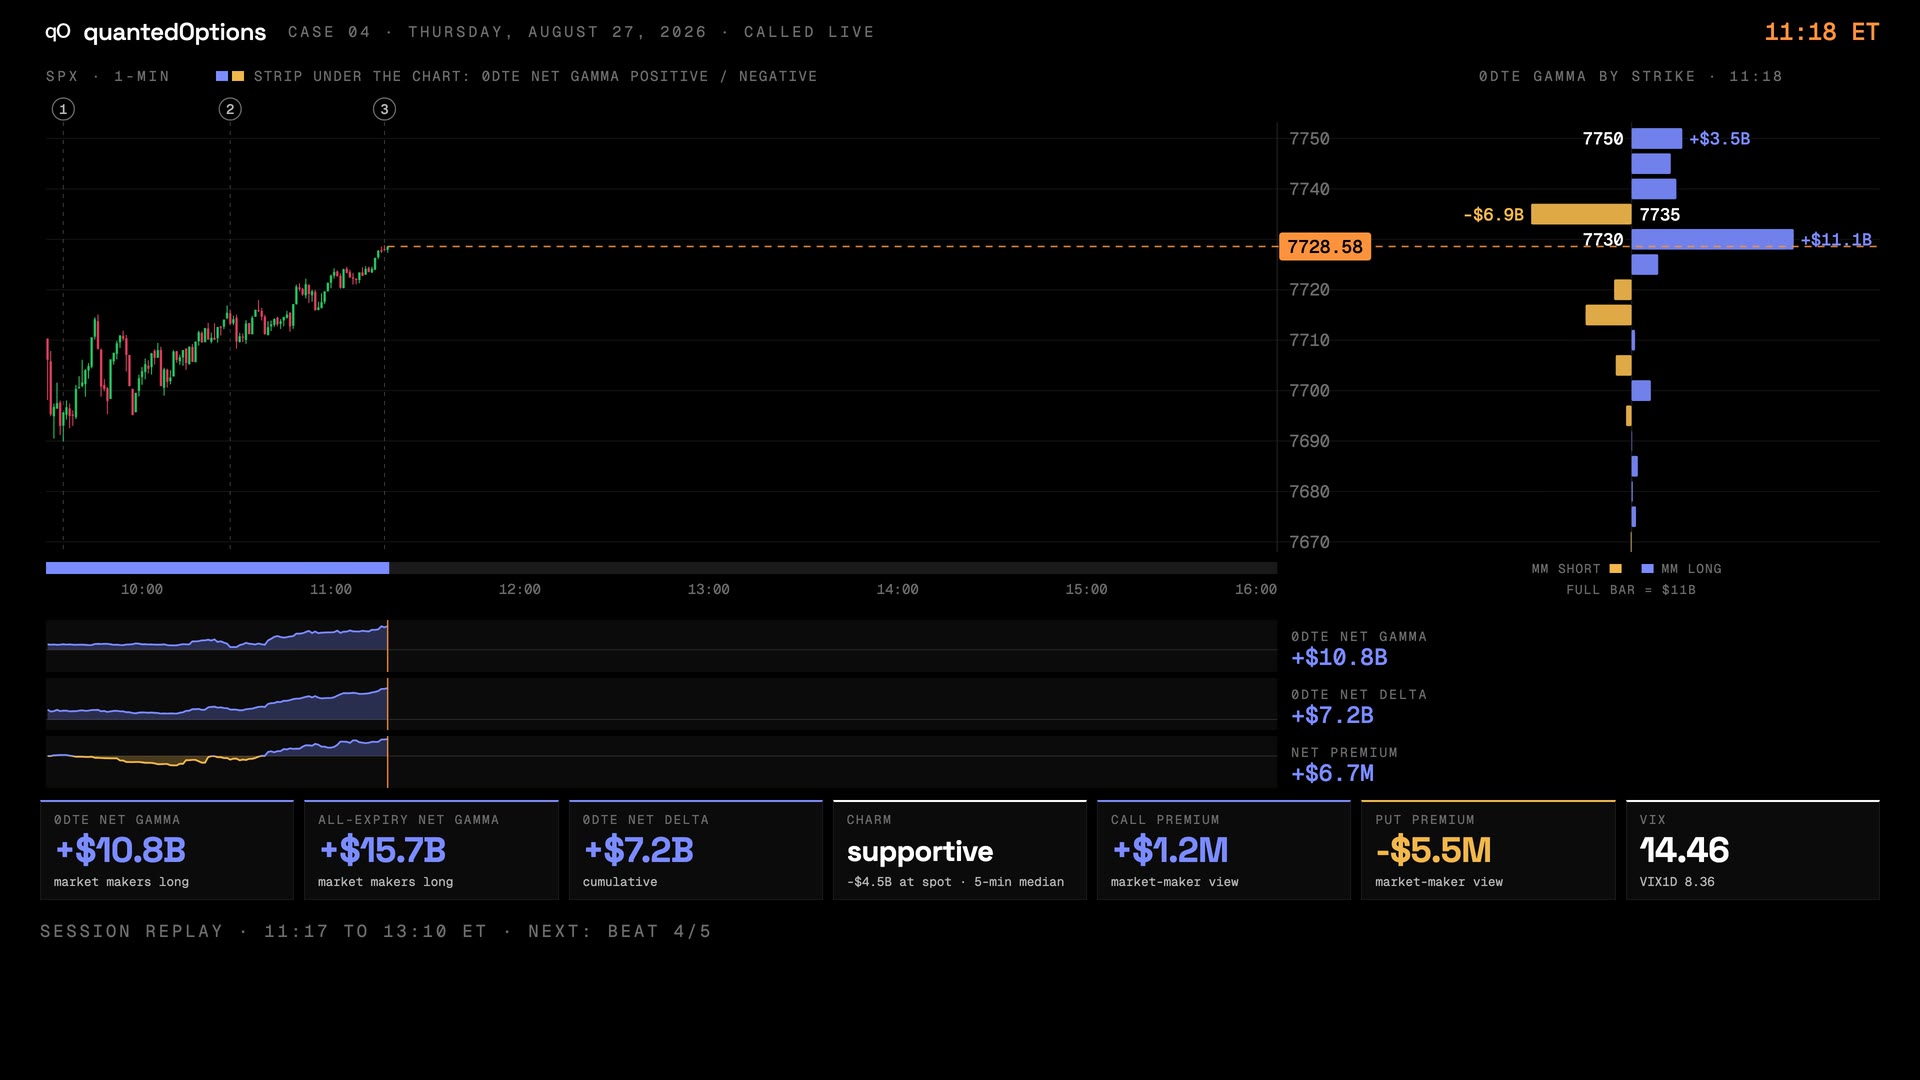 1:07
1:07A pop in gamma at 7730 and 7740, and the squeeze 49 minutes later
Two strikes lit up at 10:28. Price was 17 points under them.
The bullish stack
 1:07
1:07Put selling all morning, supportive charm, and 7650 overhead
The whole book was negative gamma. The 0DTE book was building a ceiling.
The bullish stack
These pages describe what the displays show and what the data did on the sessions shown. They are not trading advice, and a past session is not a forecast of a future one.